We put the Samsung Galaxy S26 Ultra through our rigorous DXOMARK Camera test suite to measure its performance in photo, video, and zoom quality from an end-user perspective. This article breaks down how the device fared in a variety of tests and several common use cases and is intended to highlight the most important results of our testing with an extract of the captured data.
Slight frame shifts during small panning shots in video
The Samsung Galaxy S26 Ultra performs strongly in the DXOMARK Camera test, bringing meaningful and well-implemented improvements over the previous generation of Samsung flagship devices particularly in low light, where the larger aperture and refined image processing deliver better detail, lower noise, and more stable color performance. Across photo attributes, the device shows clear progress in color accuracy, texture and noise trade-off, and telephoto consistency.
However, despite these gains, the S26 Ultra still falls short of many competing flagships in several critical areas. Exposure can remain unstable, noise is still more pronounced than on several competitors, and autofocus reliability especially in low light and when shooting with the ultra-wide module continues to lag behind the best in class. These shortcomings are increasingly conspicuous in a market where rivals have pushed image quality forward at a rapid pace, raising the bar at the ultra-premium level.
On the video side, improvements in exposure, color, noise control, and stabilization contribute to a solid and versatile performance, even if the top performers continue to maintain a measurable edge in demanding conditions. Overall, the S26 Ultra does not yet challenge the segment leaders, but remains a substantial and coherent upgrade that strengthens Samsung’s position and brings it closer to the front of the pack without fully closing the gap.
BEST 149
Top score Vivo X300 Pro
Lowlight
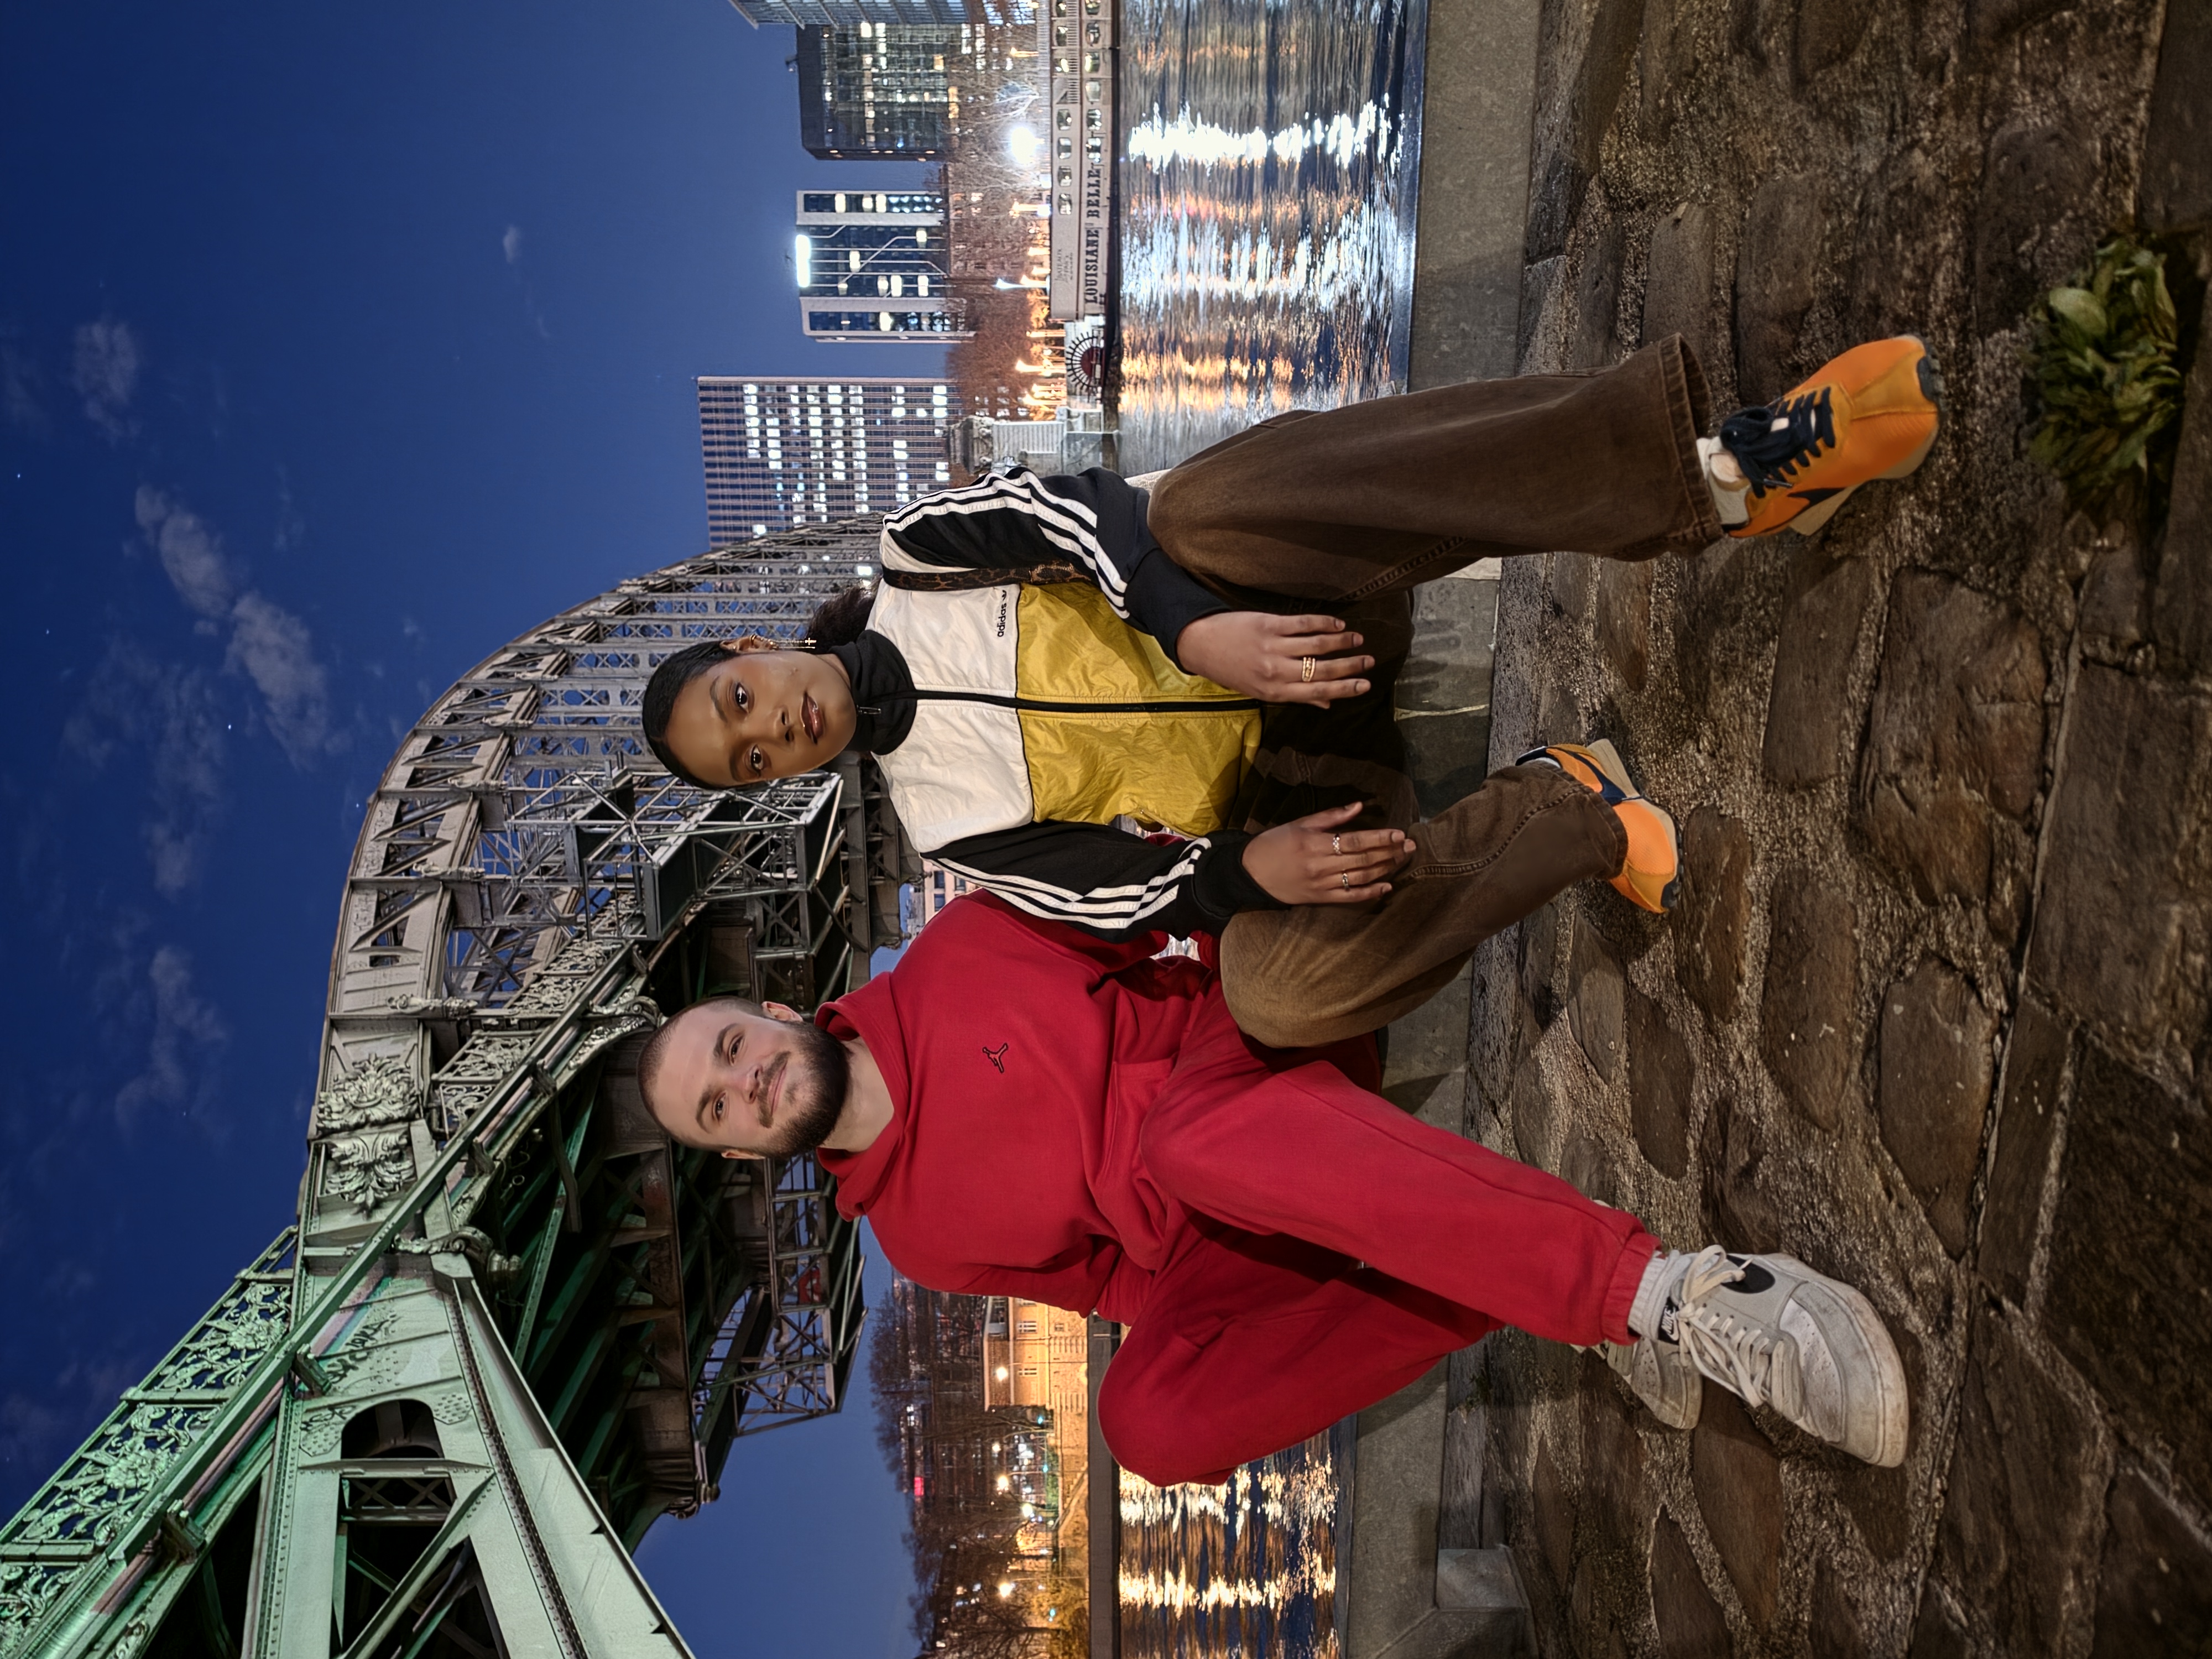
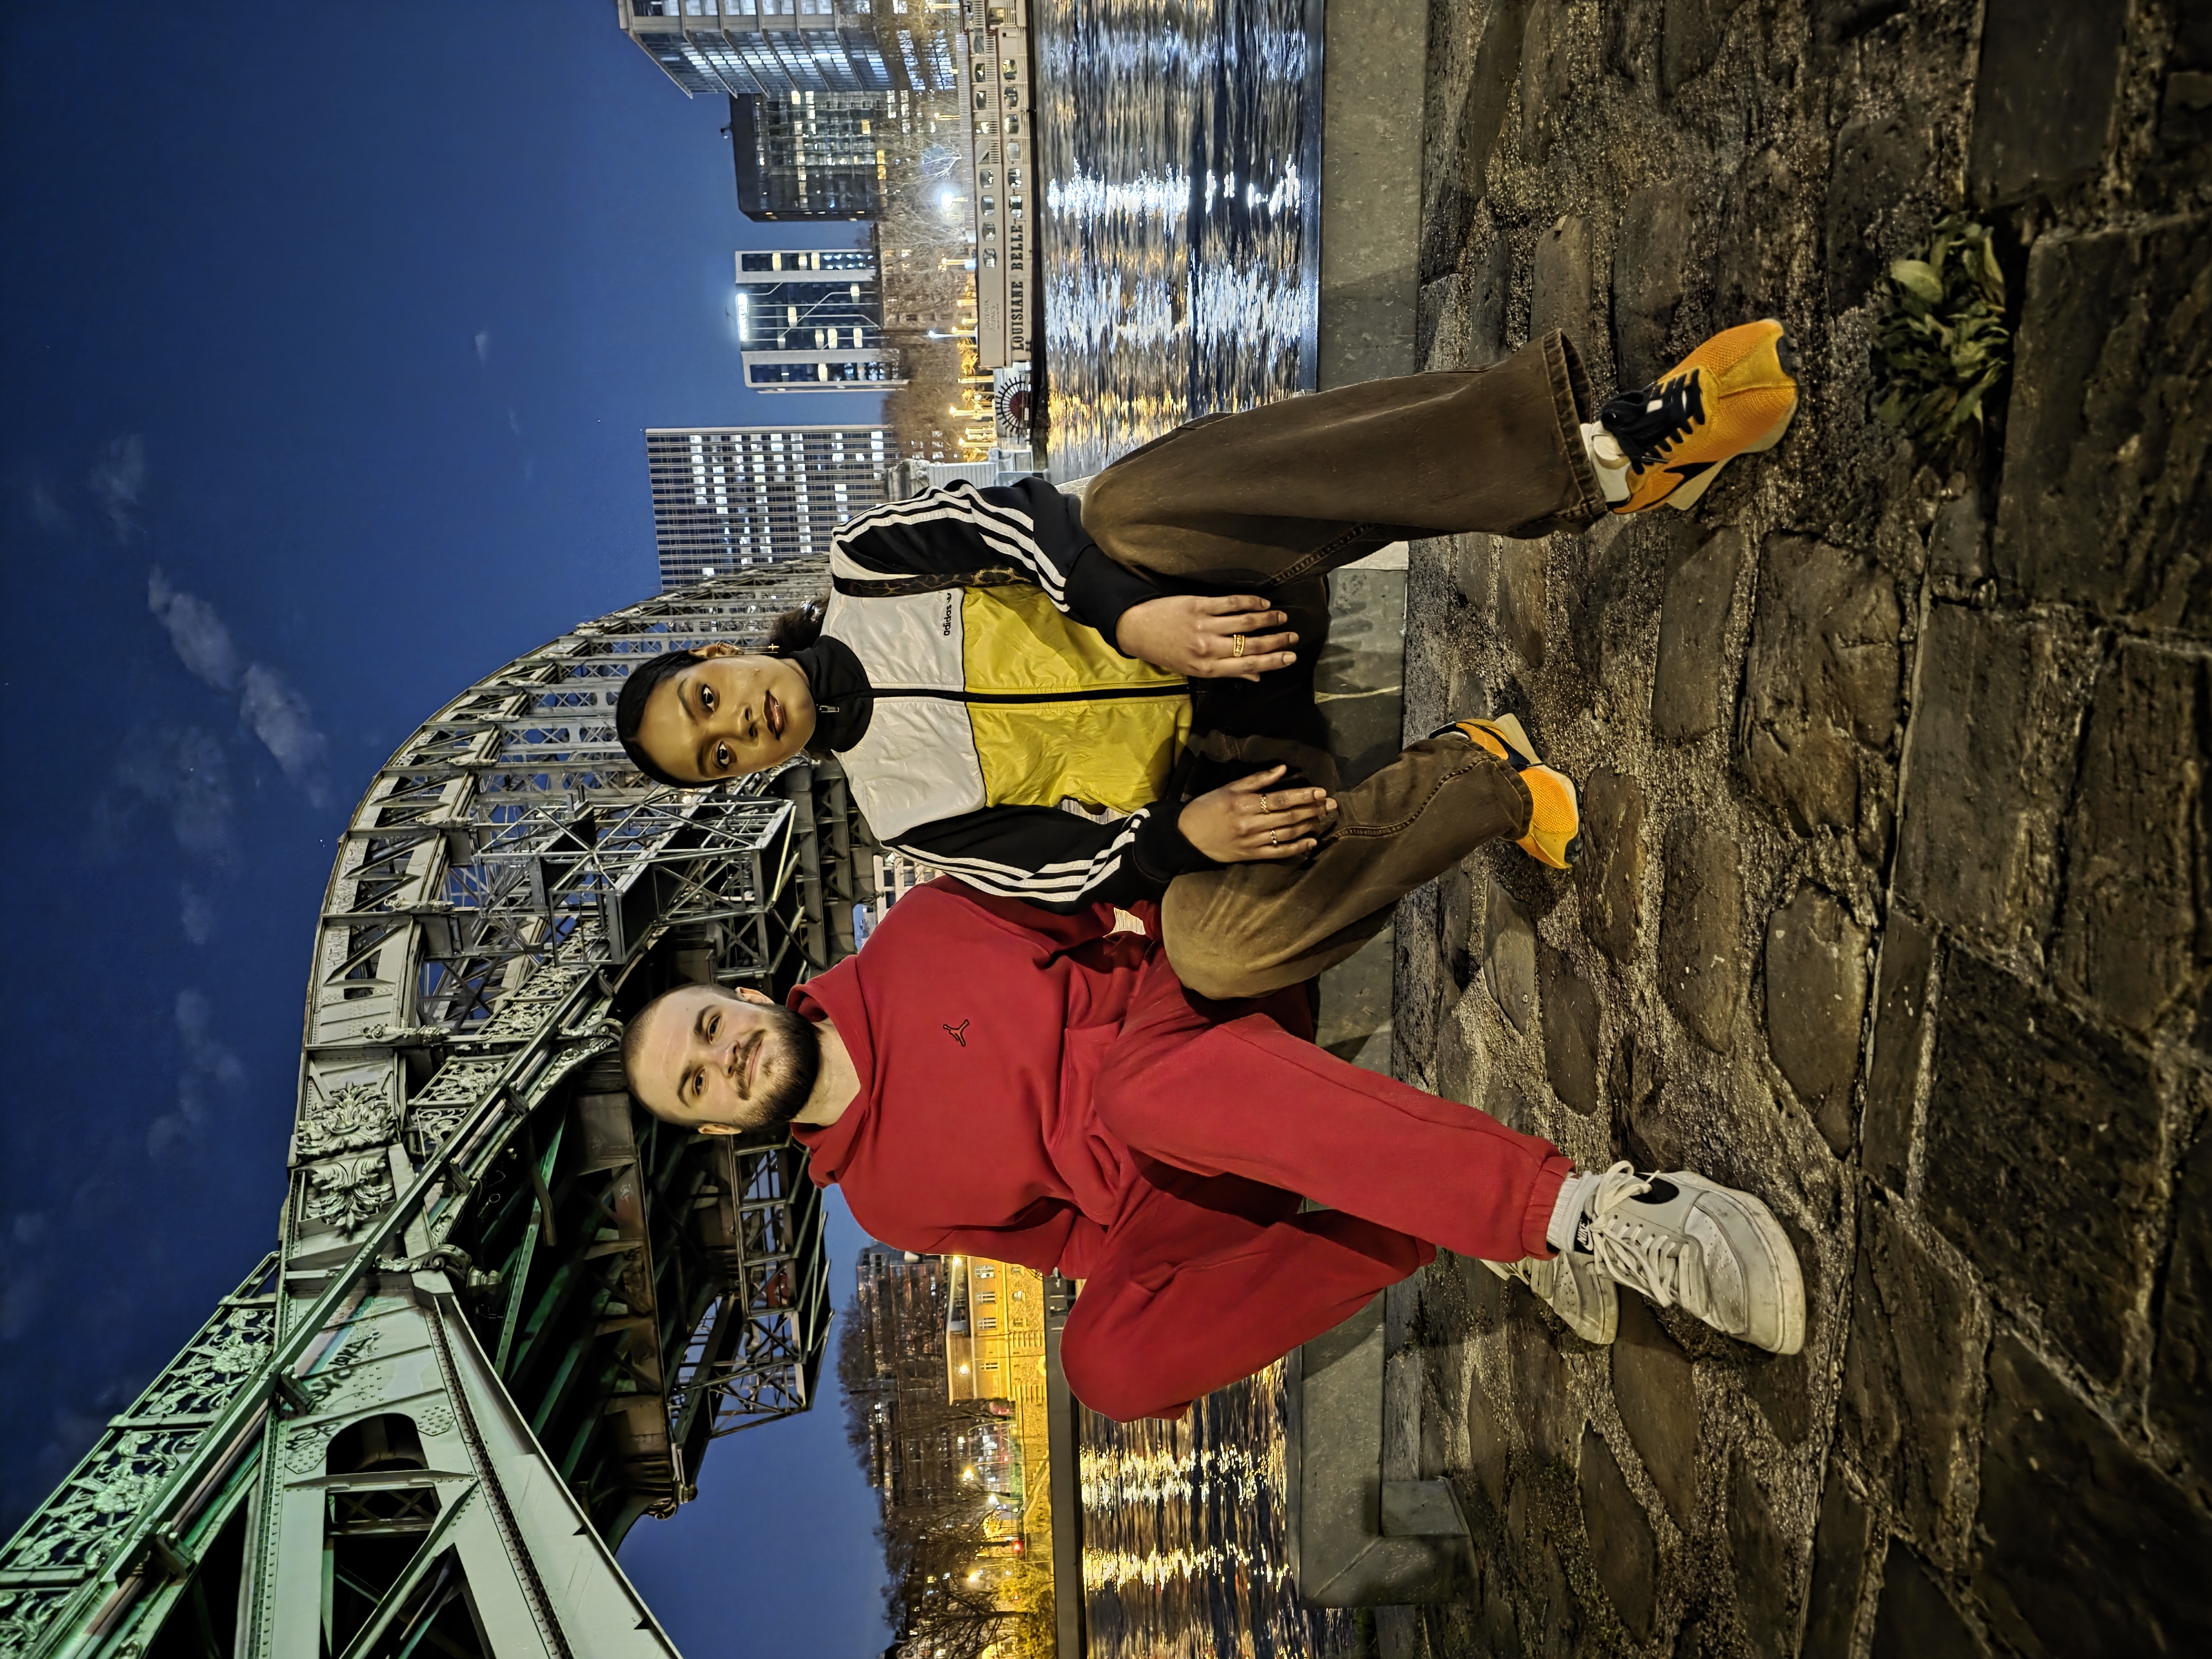
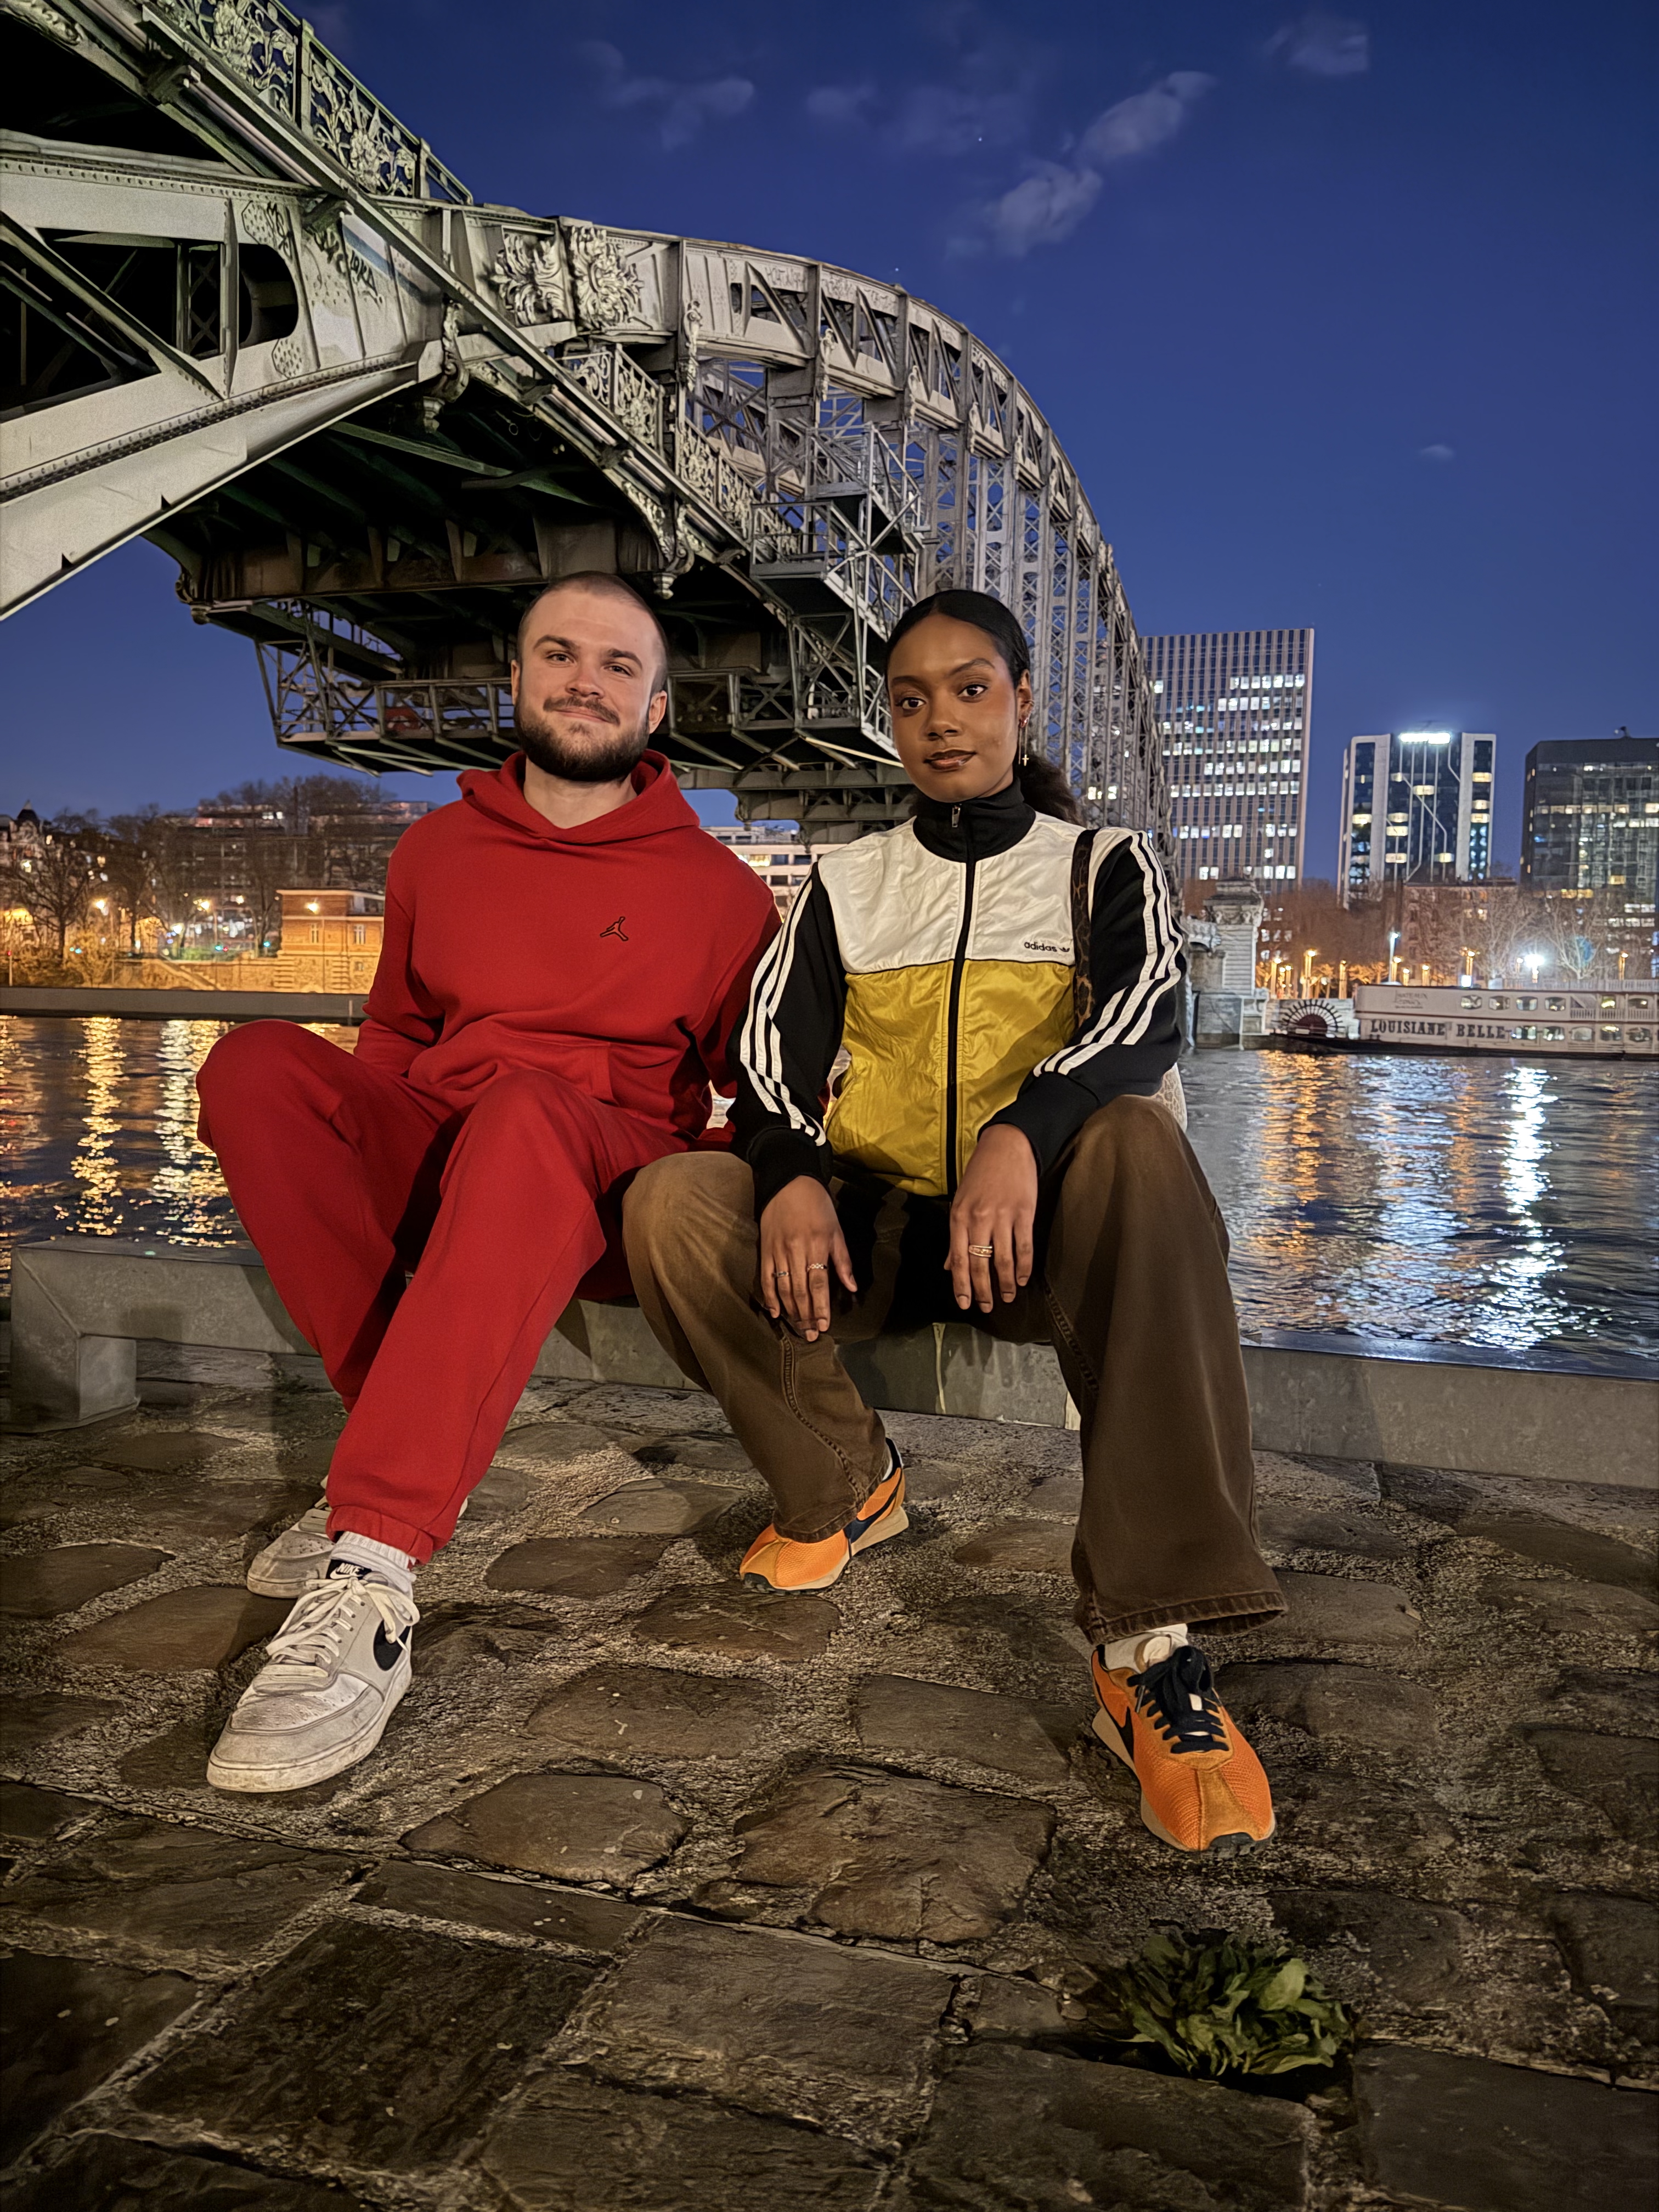
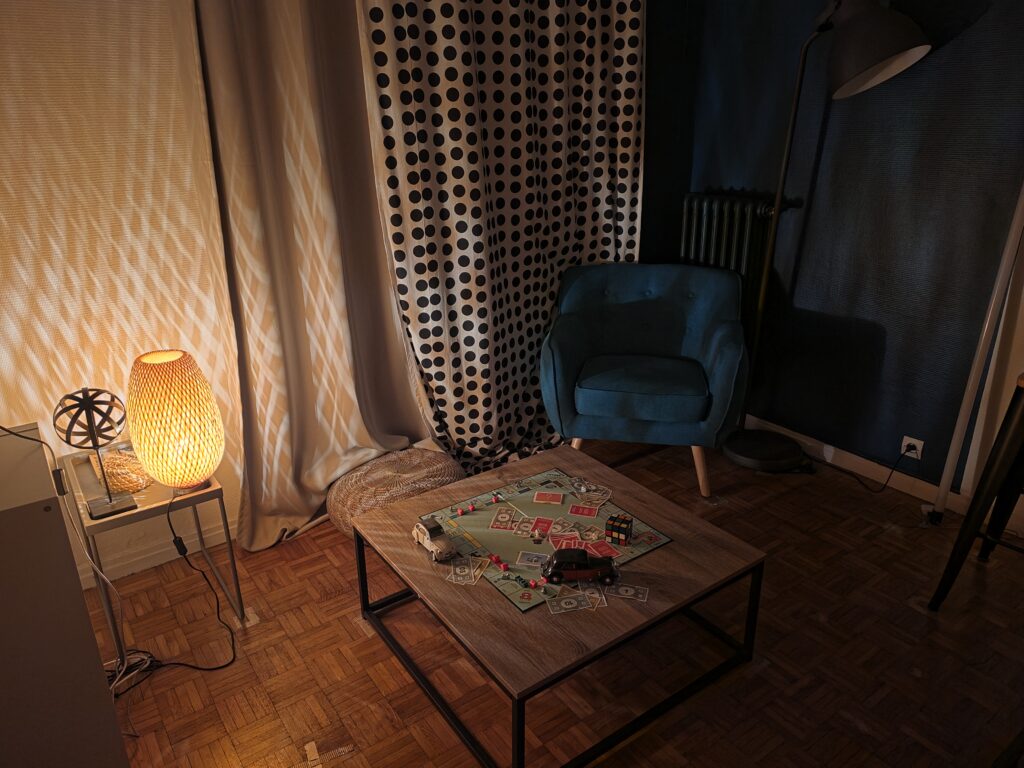
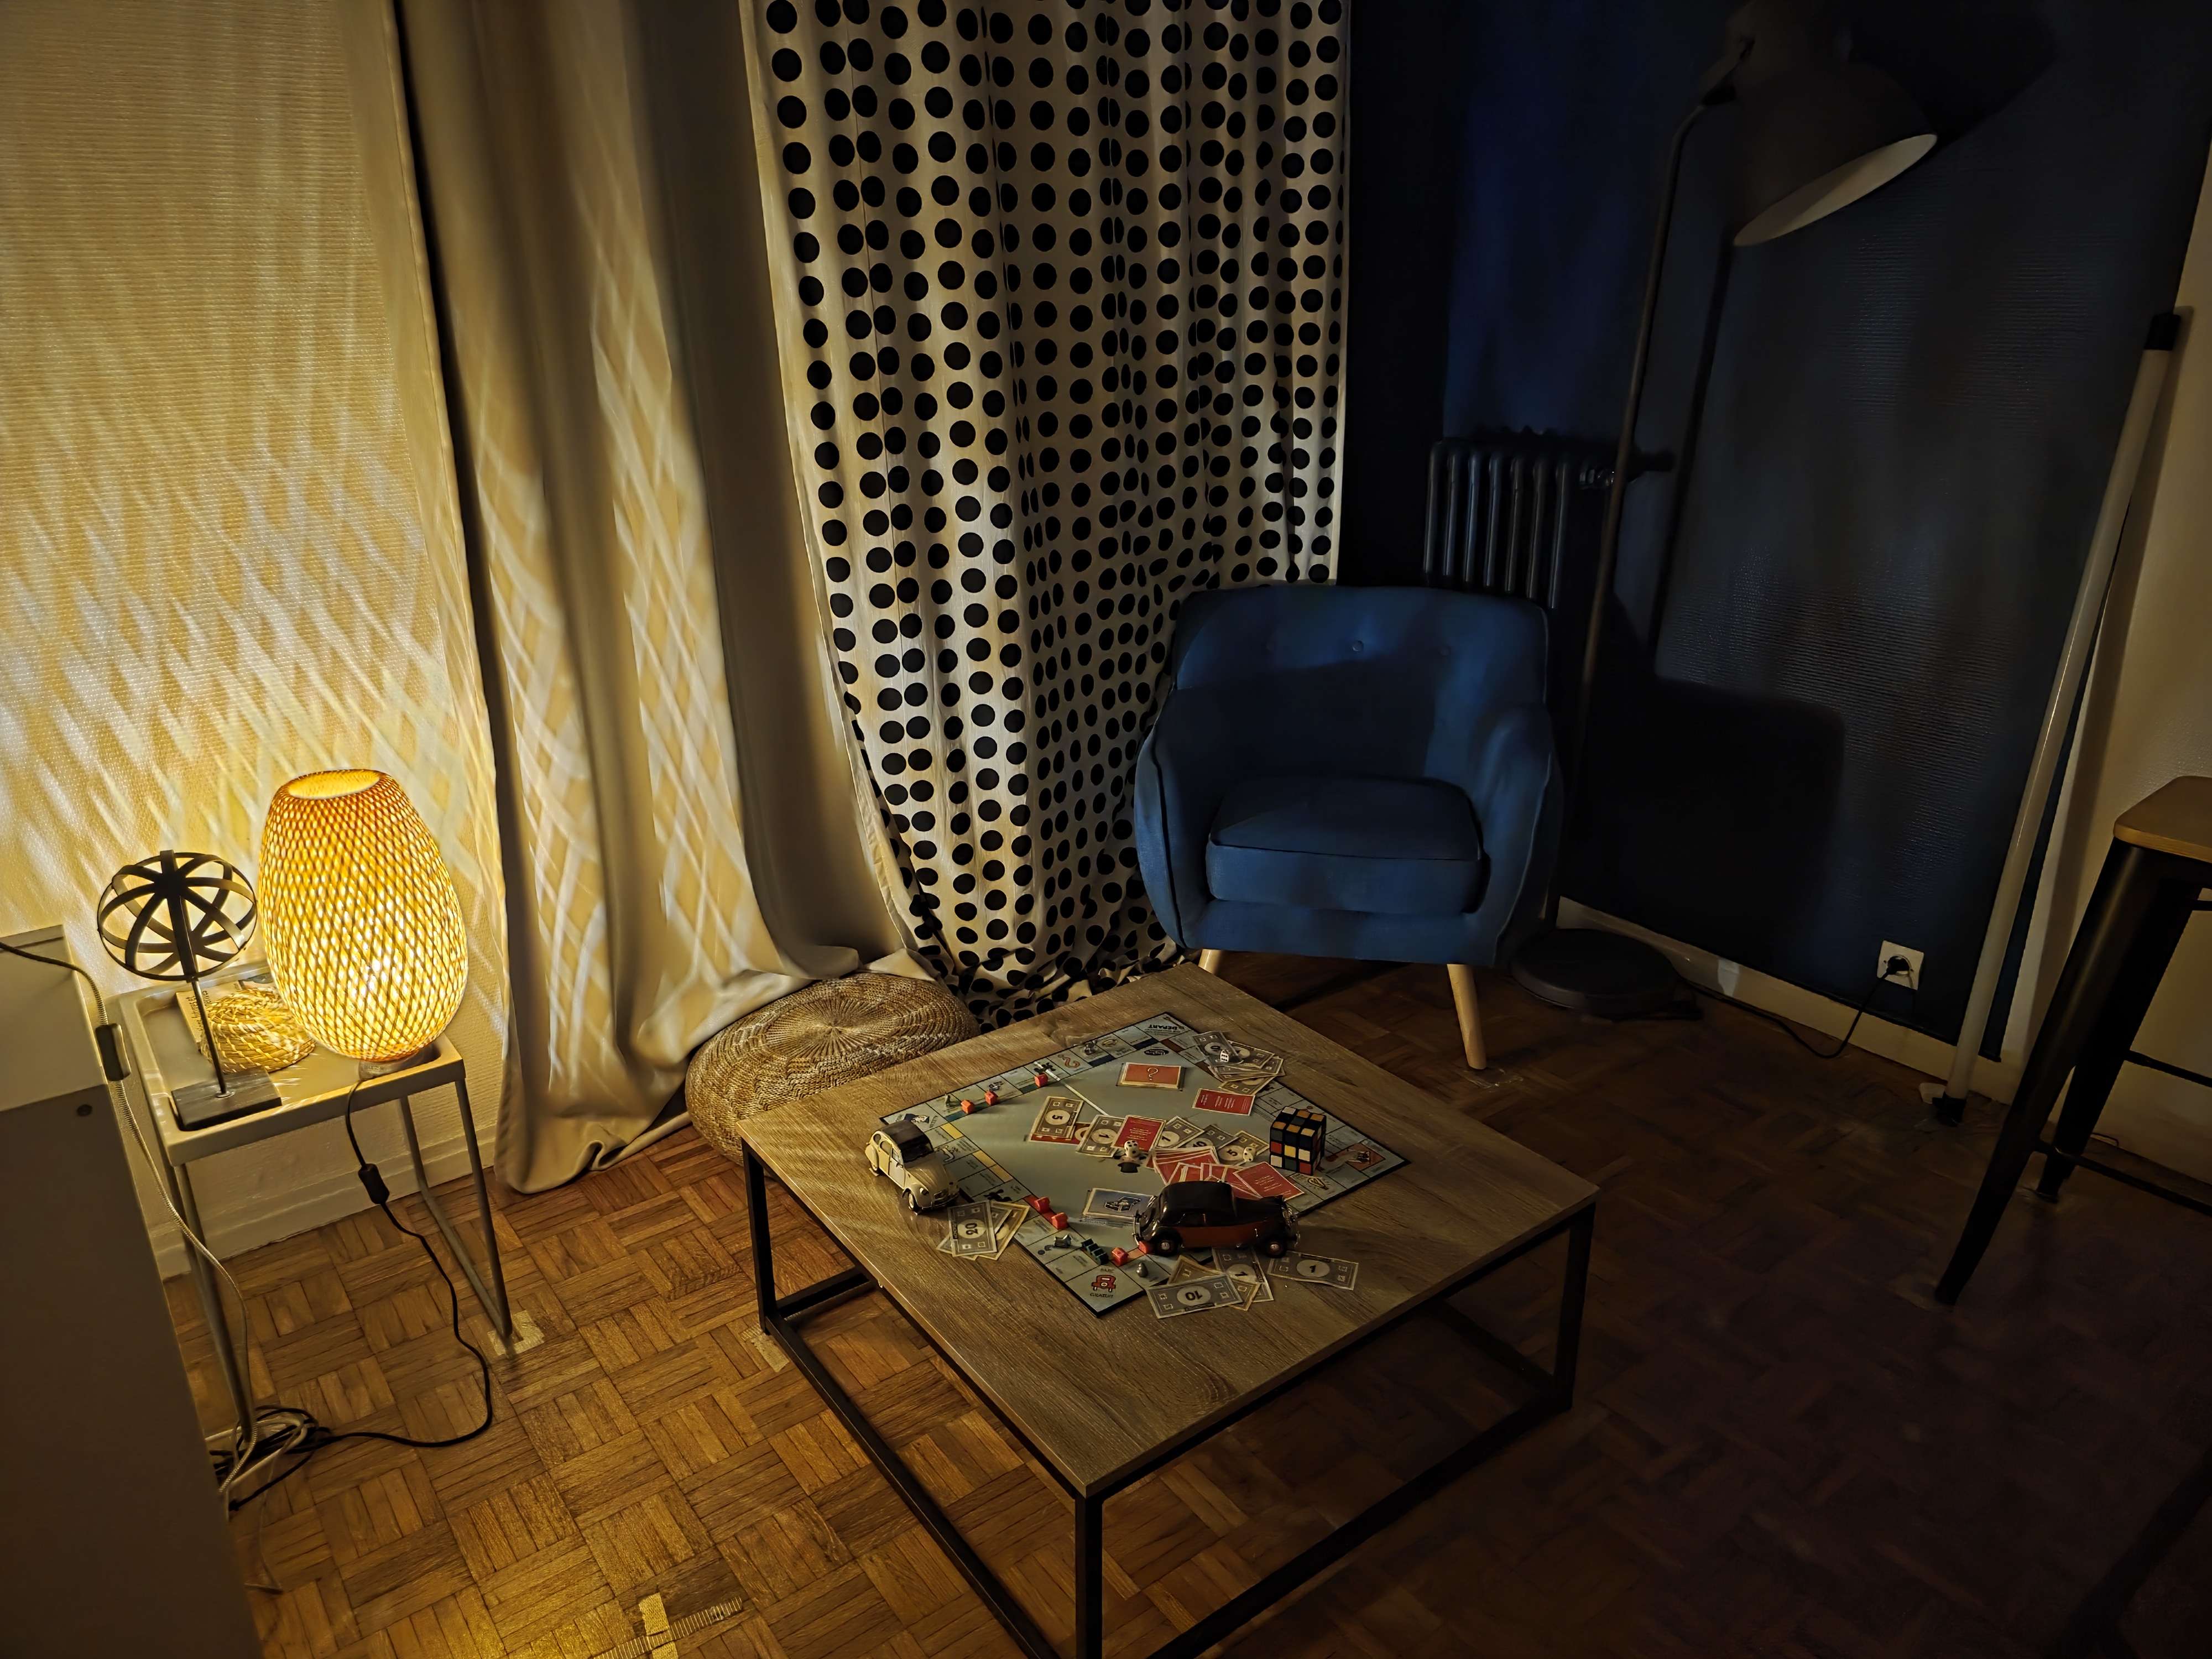
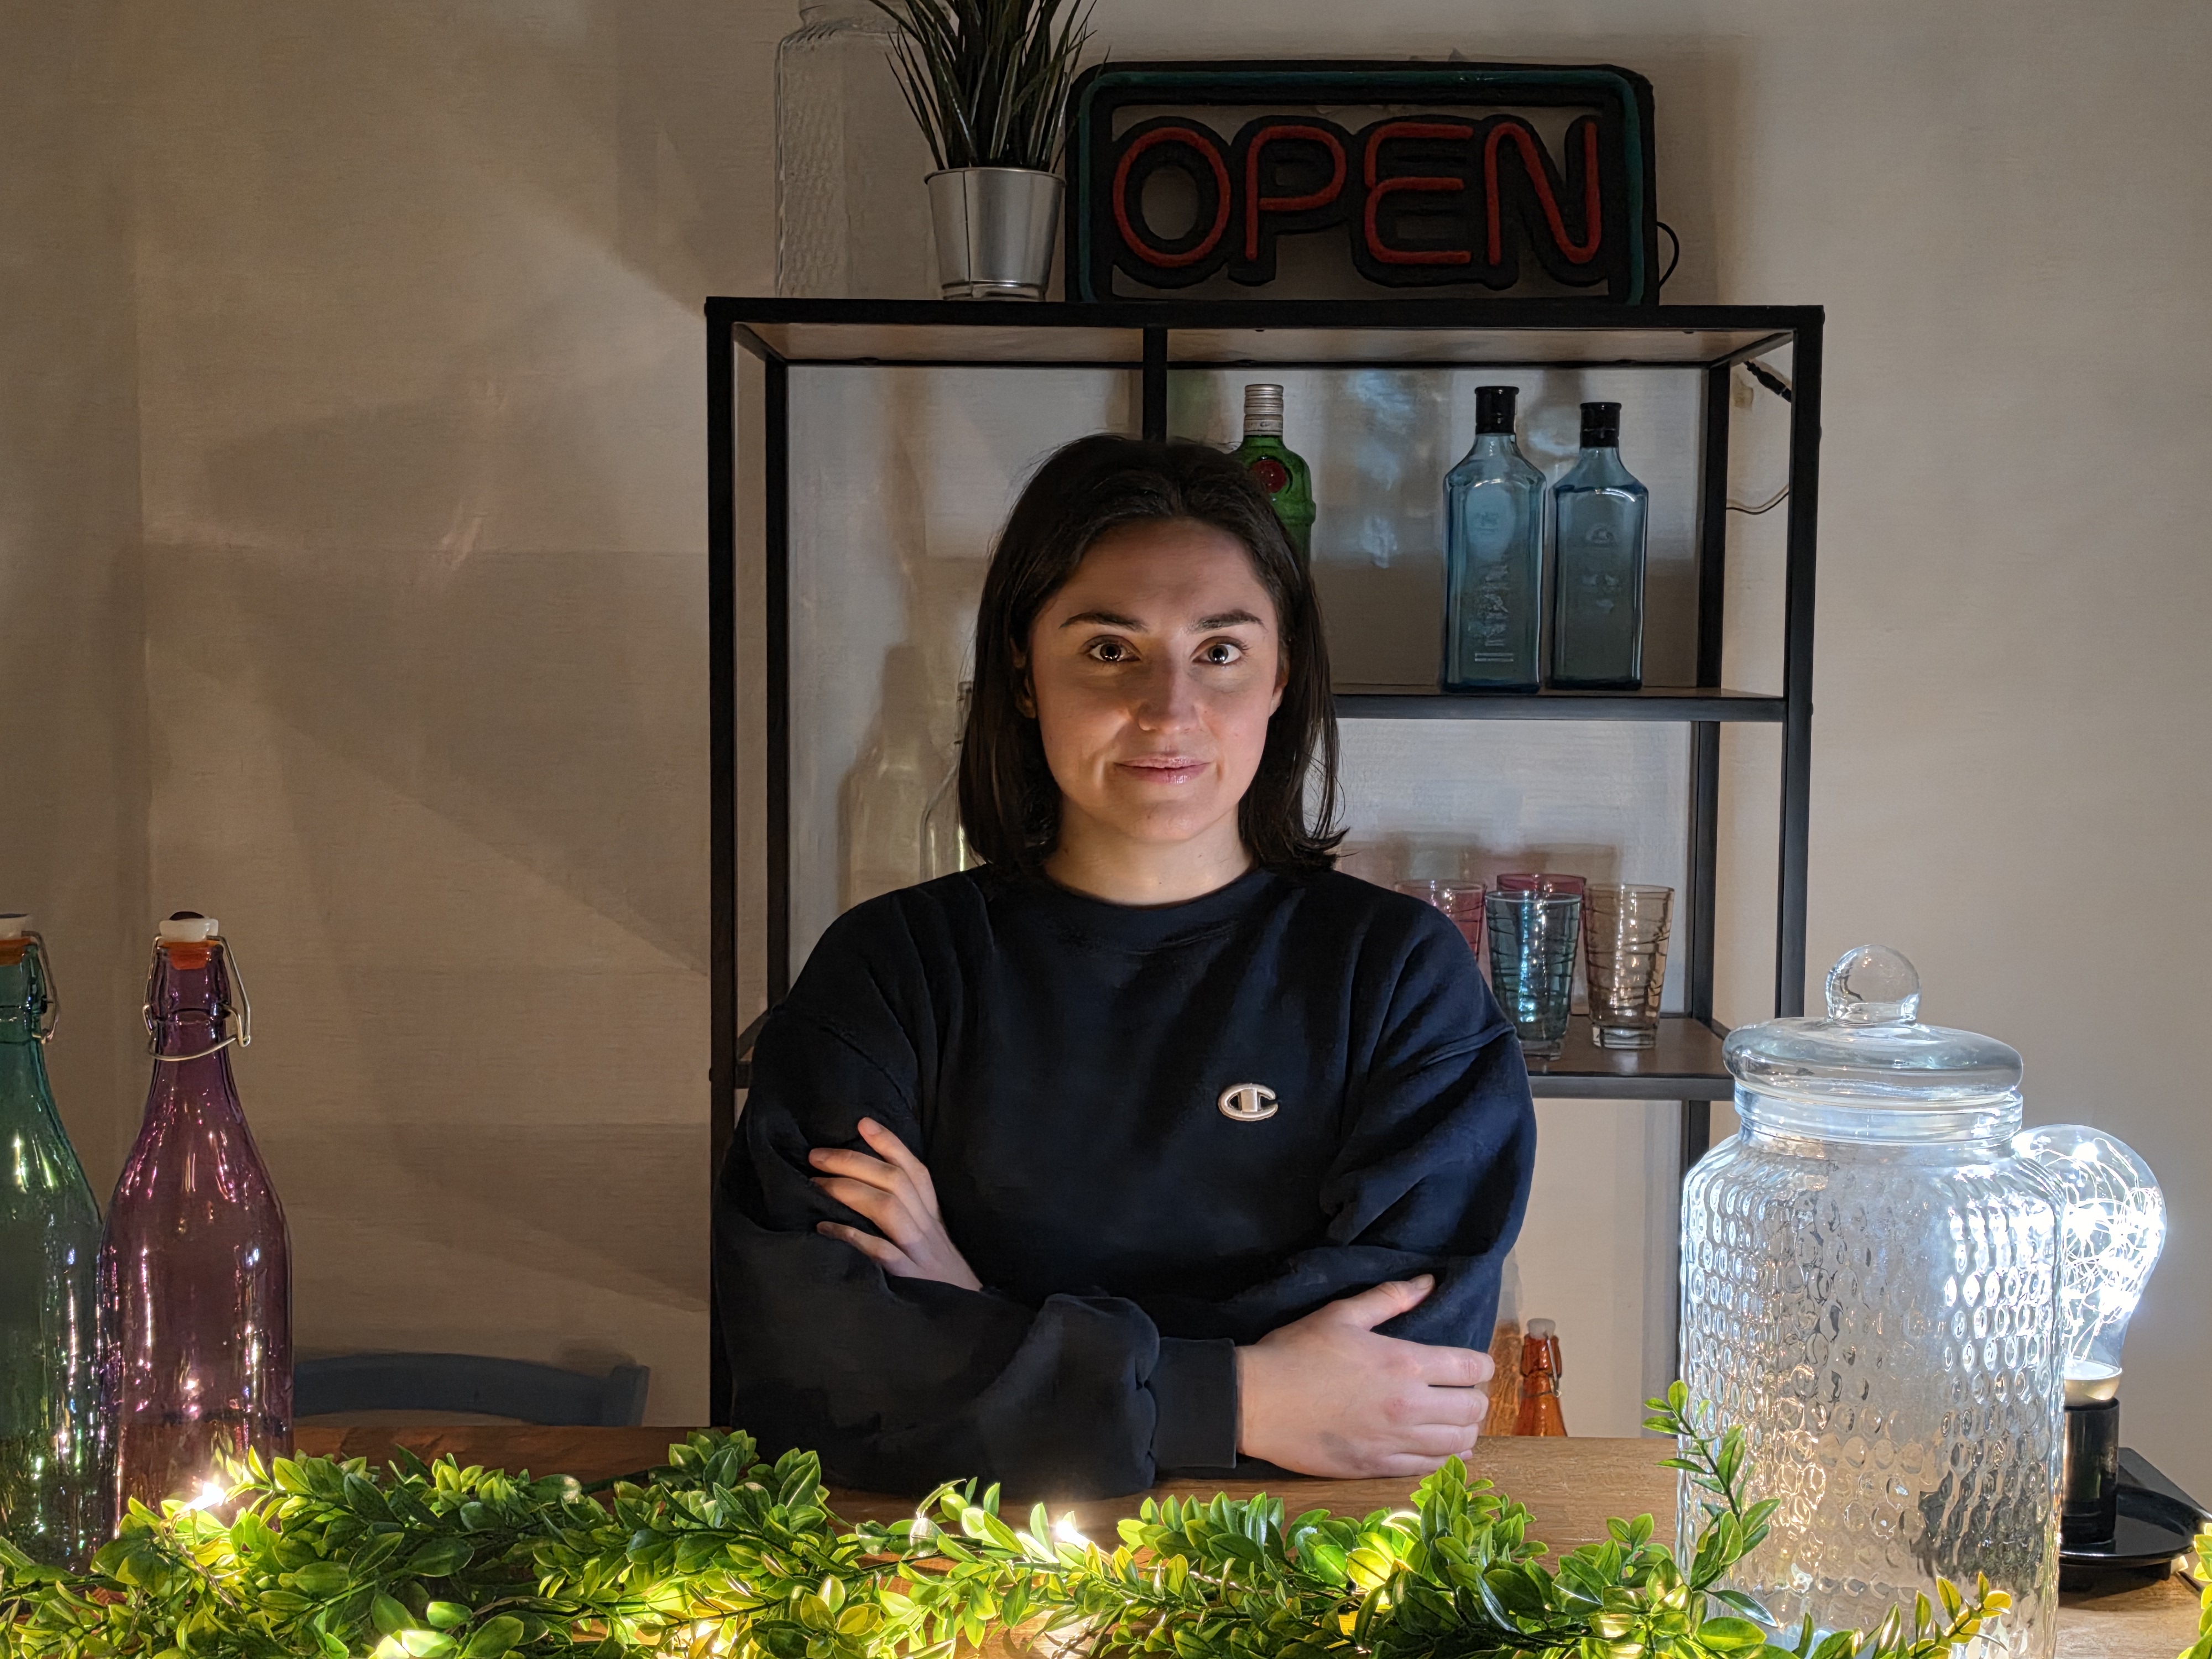
One of the S26 Ultra’s standout improvements over its predecessors is its low-light performance. The new camera features a faster aperture alongside refined image processing across key attributes — including texture, noise, and color — resulting in significantly improved low-light scores for both photo and video, and a noticeable step forward from the previous generation.
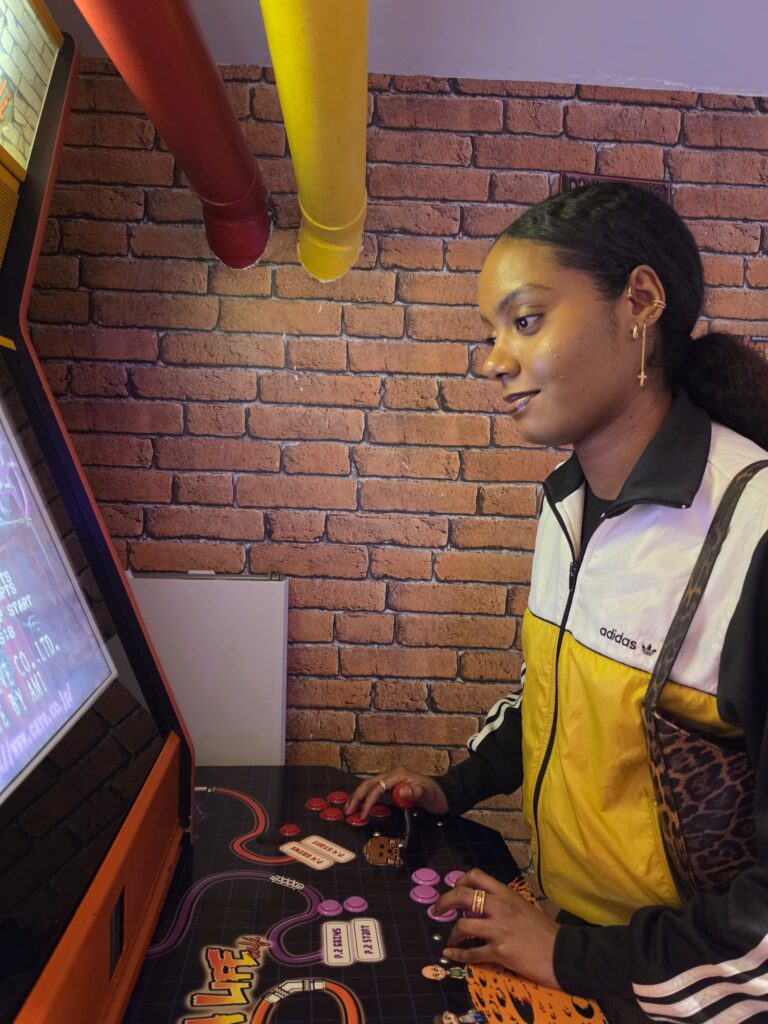
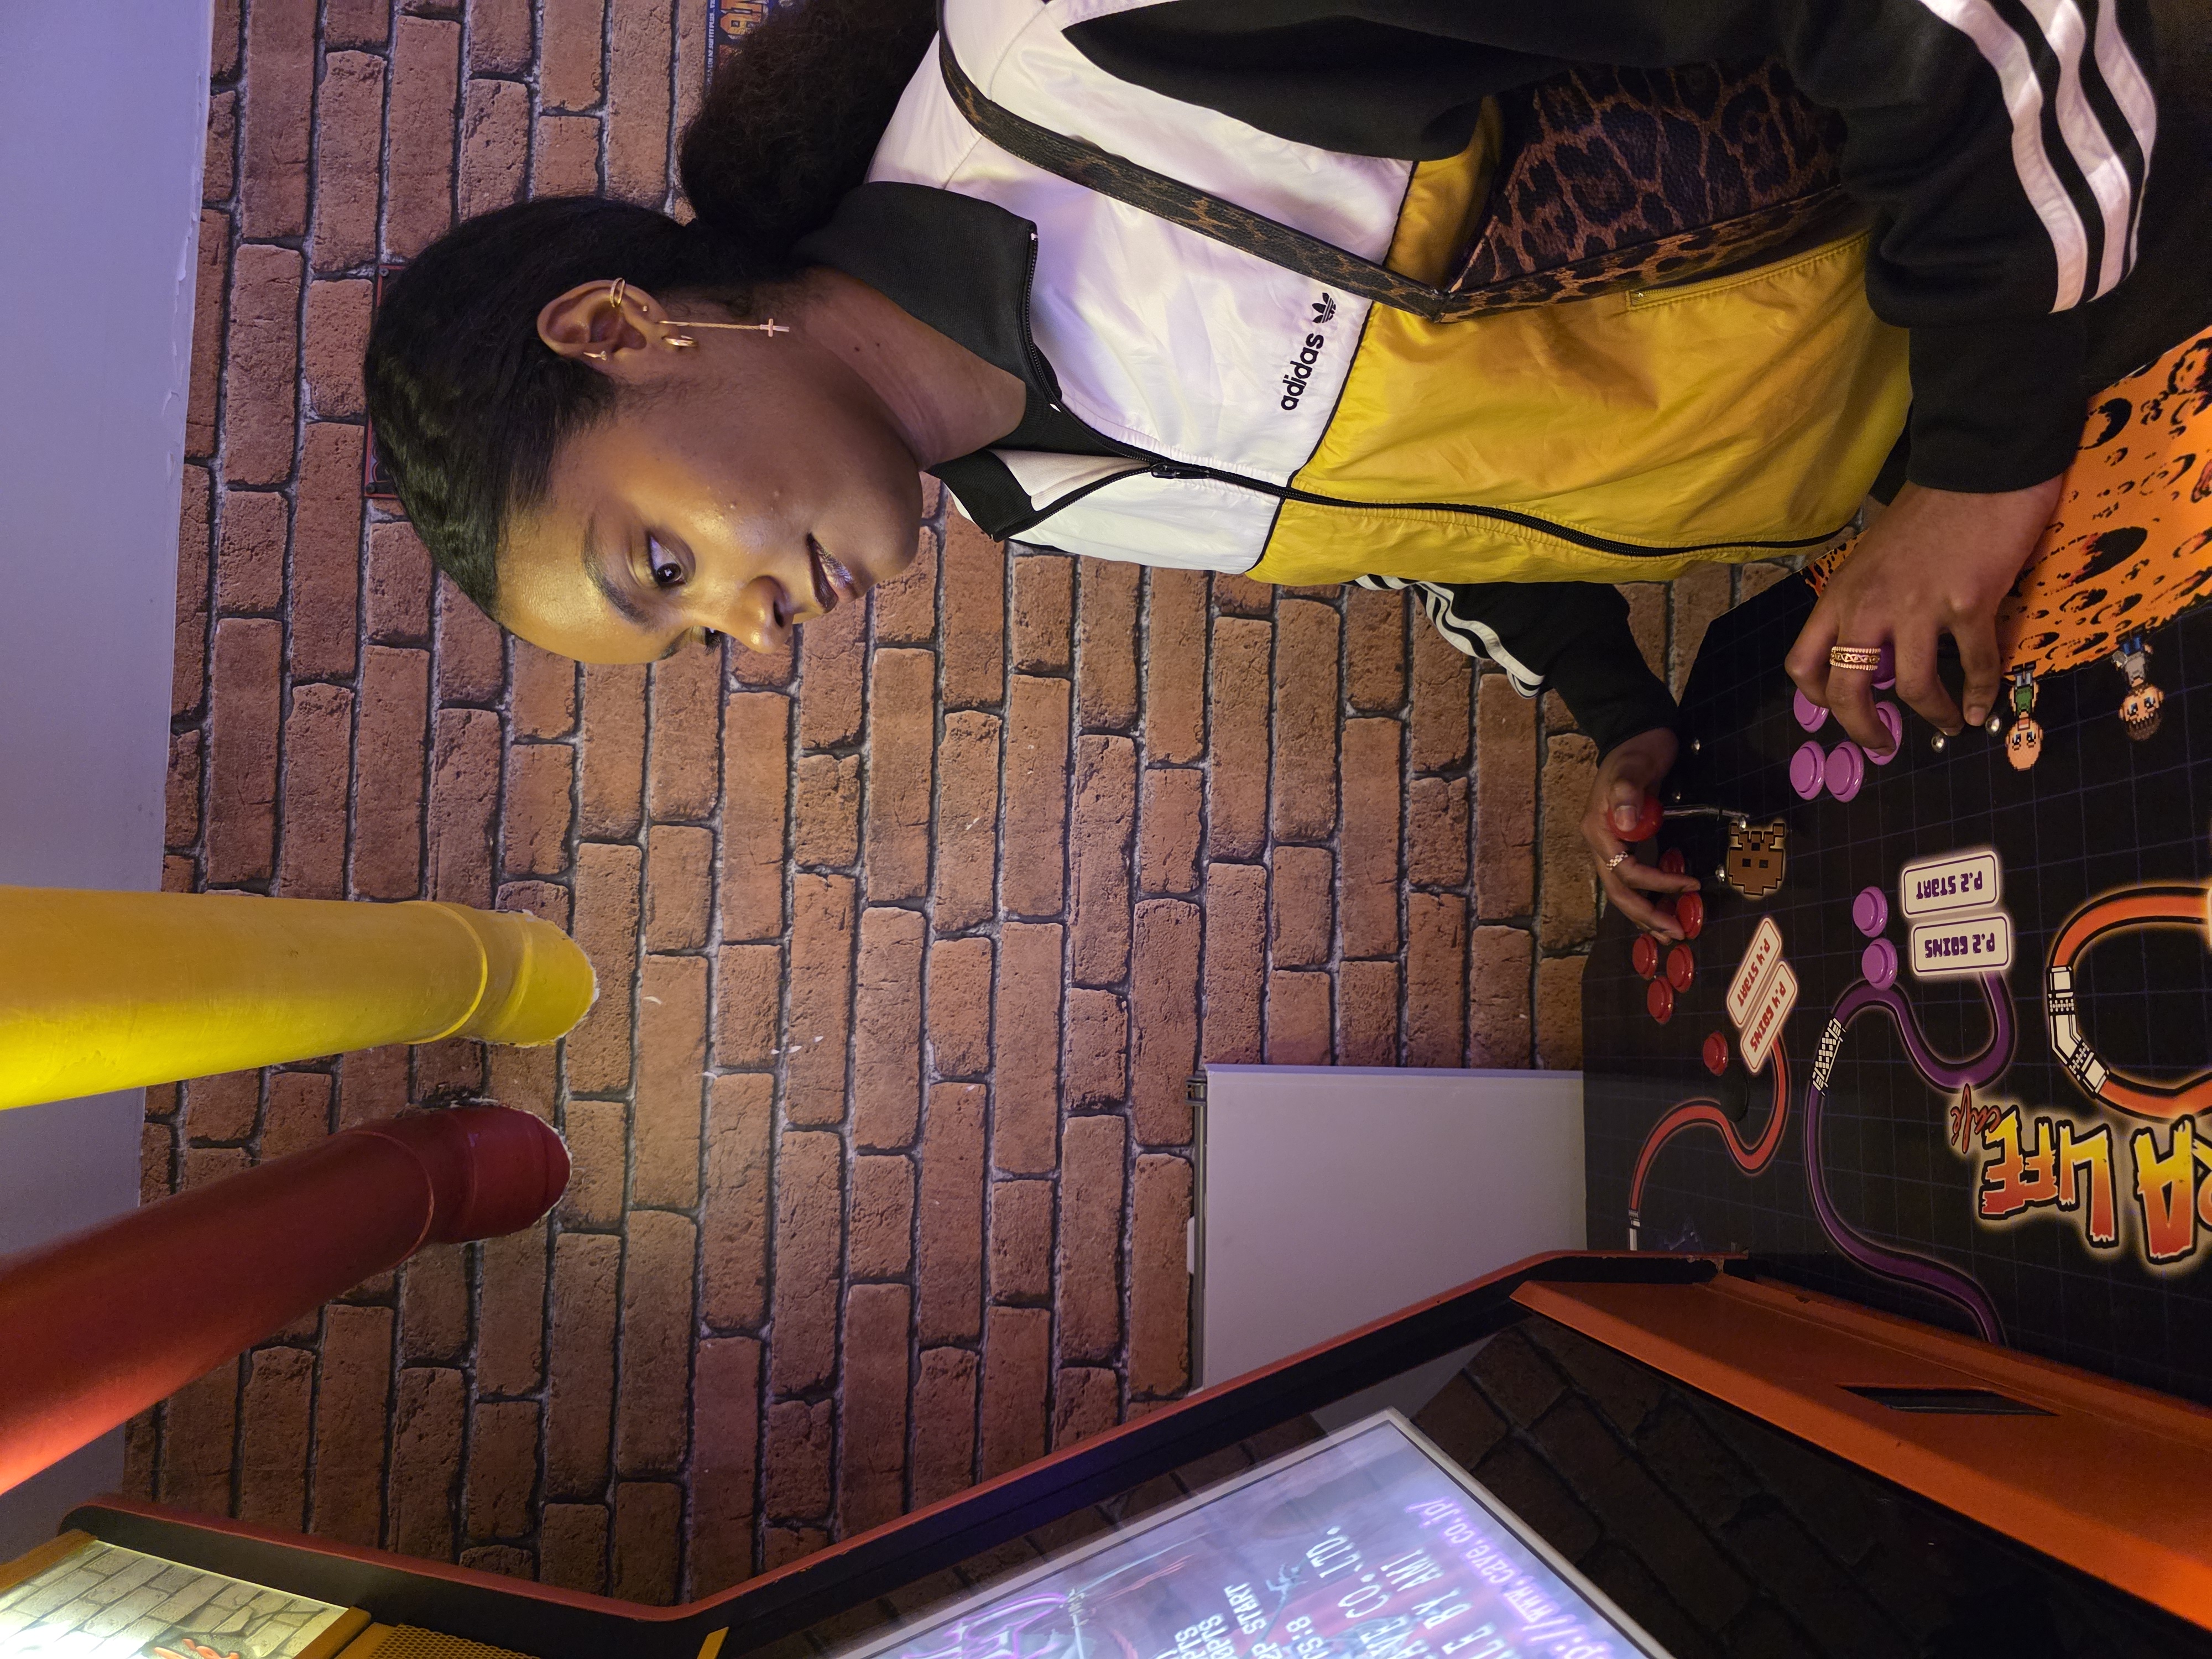
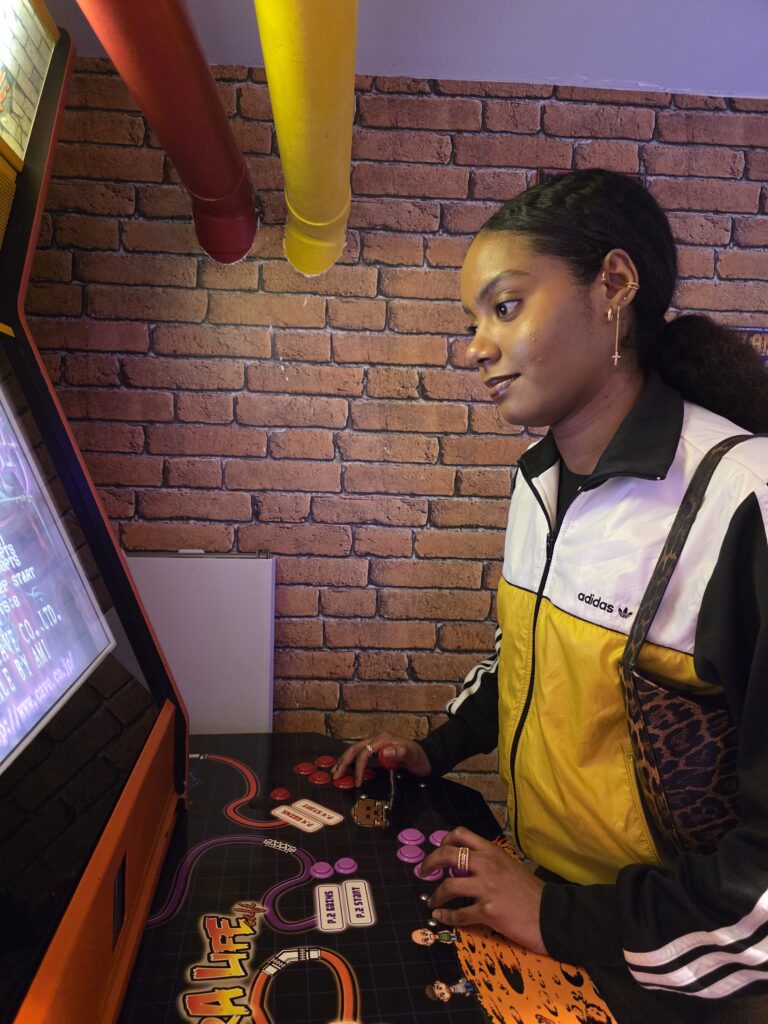
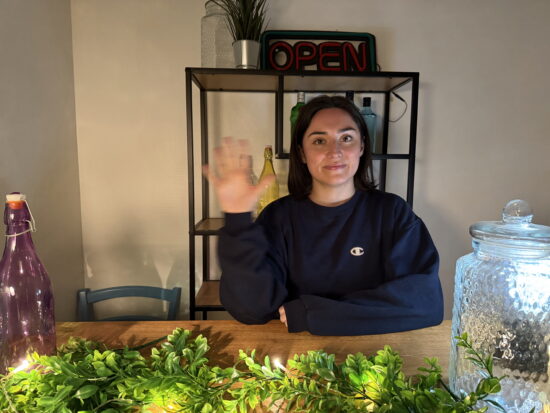
Samsung Galaxy S26 Ultra – Night shot: Bright rendering on HDR screen, nice colors
BEST 169
Top score Huawei Pura 80 Ultra
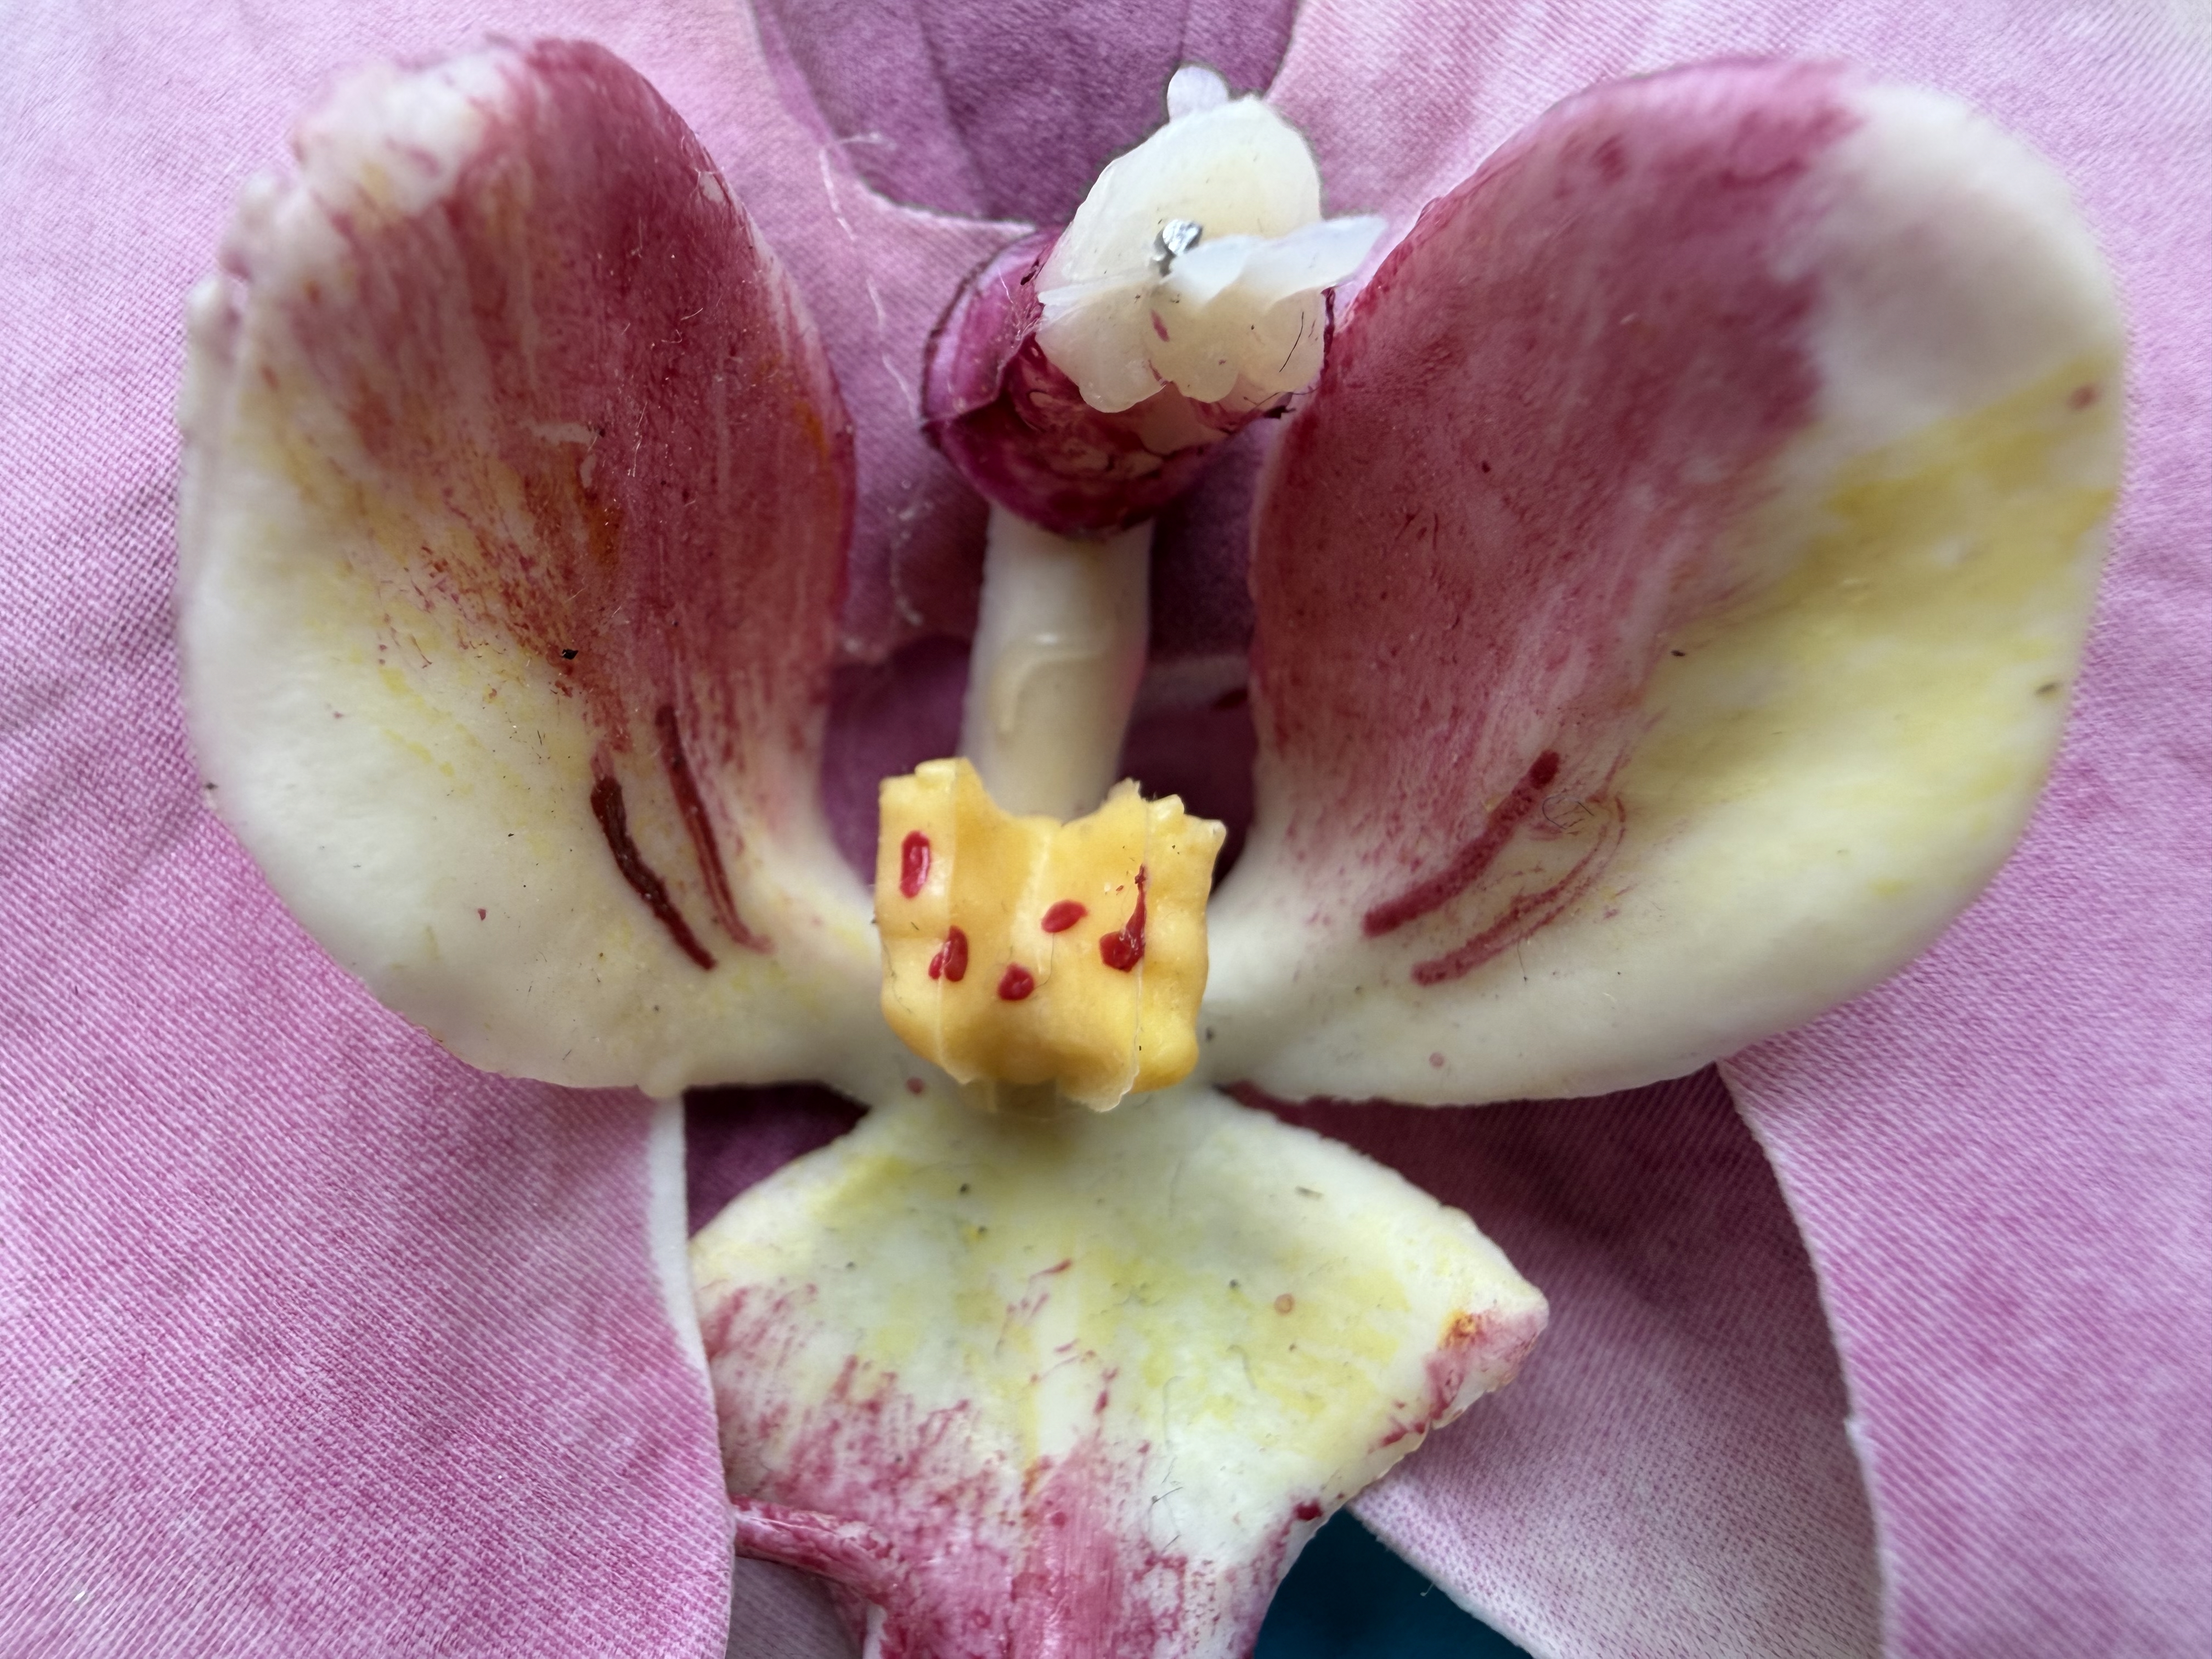
Portrait
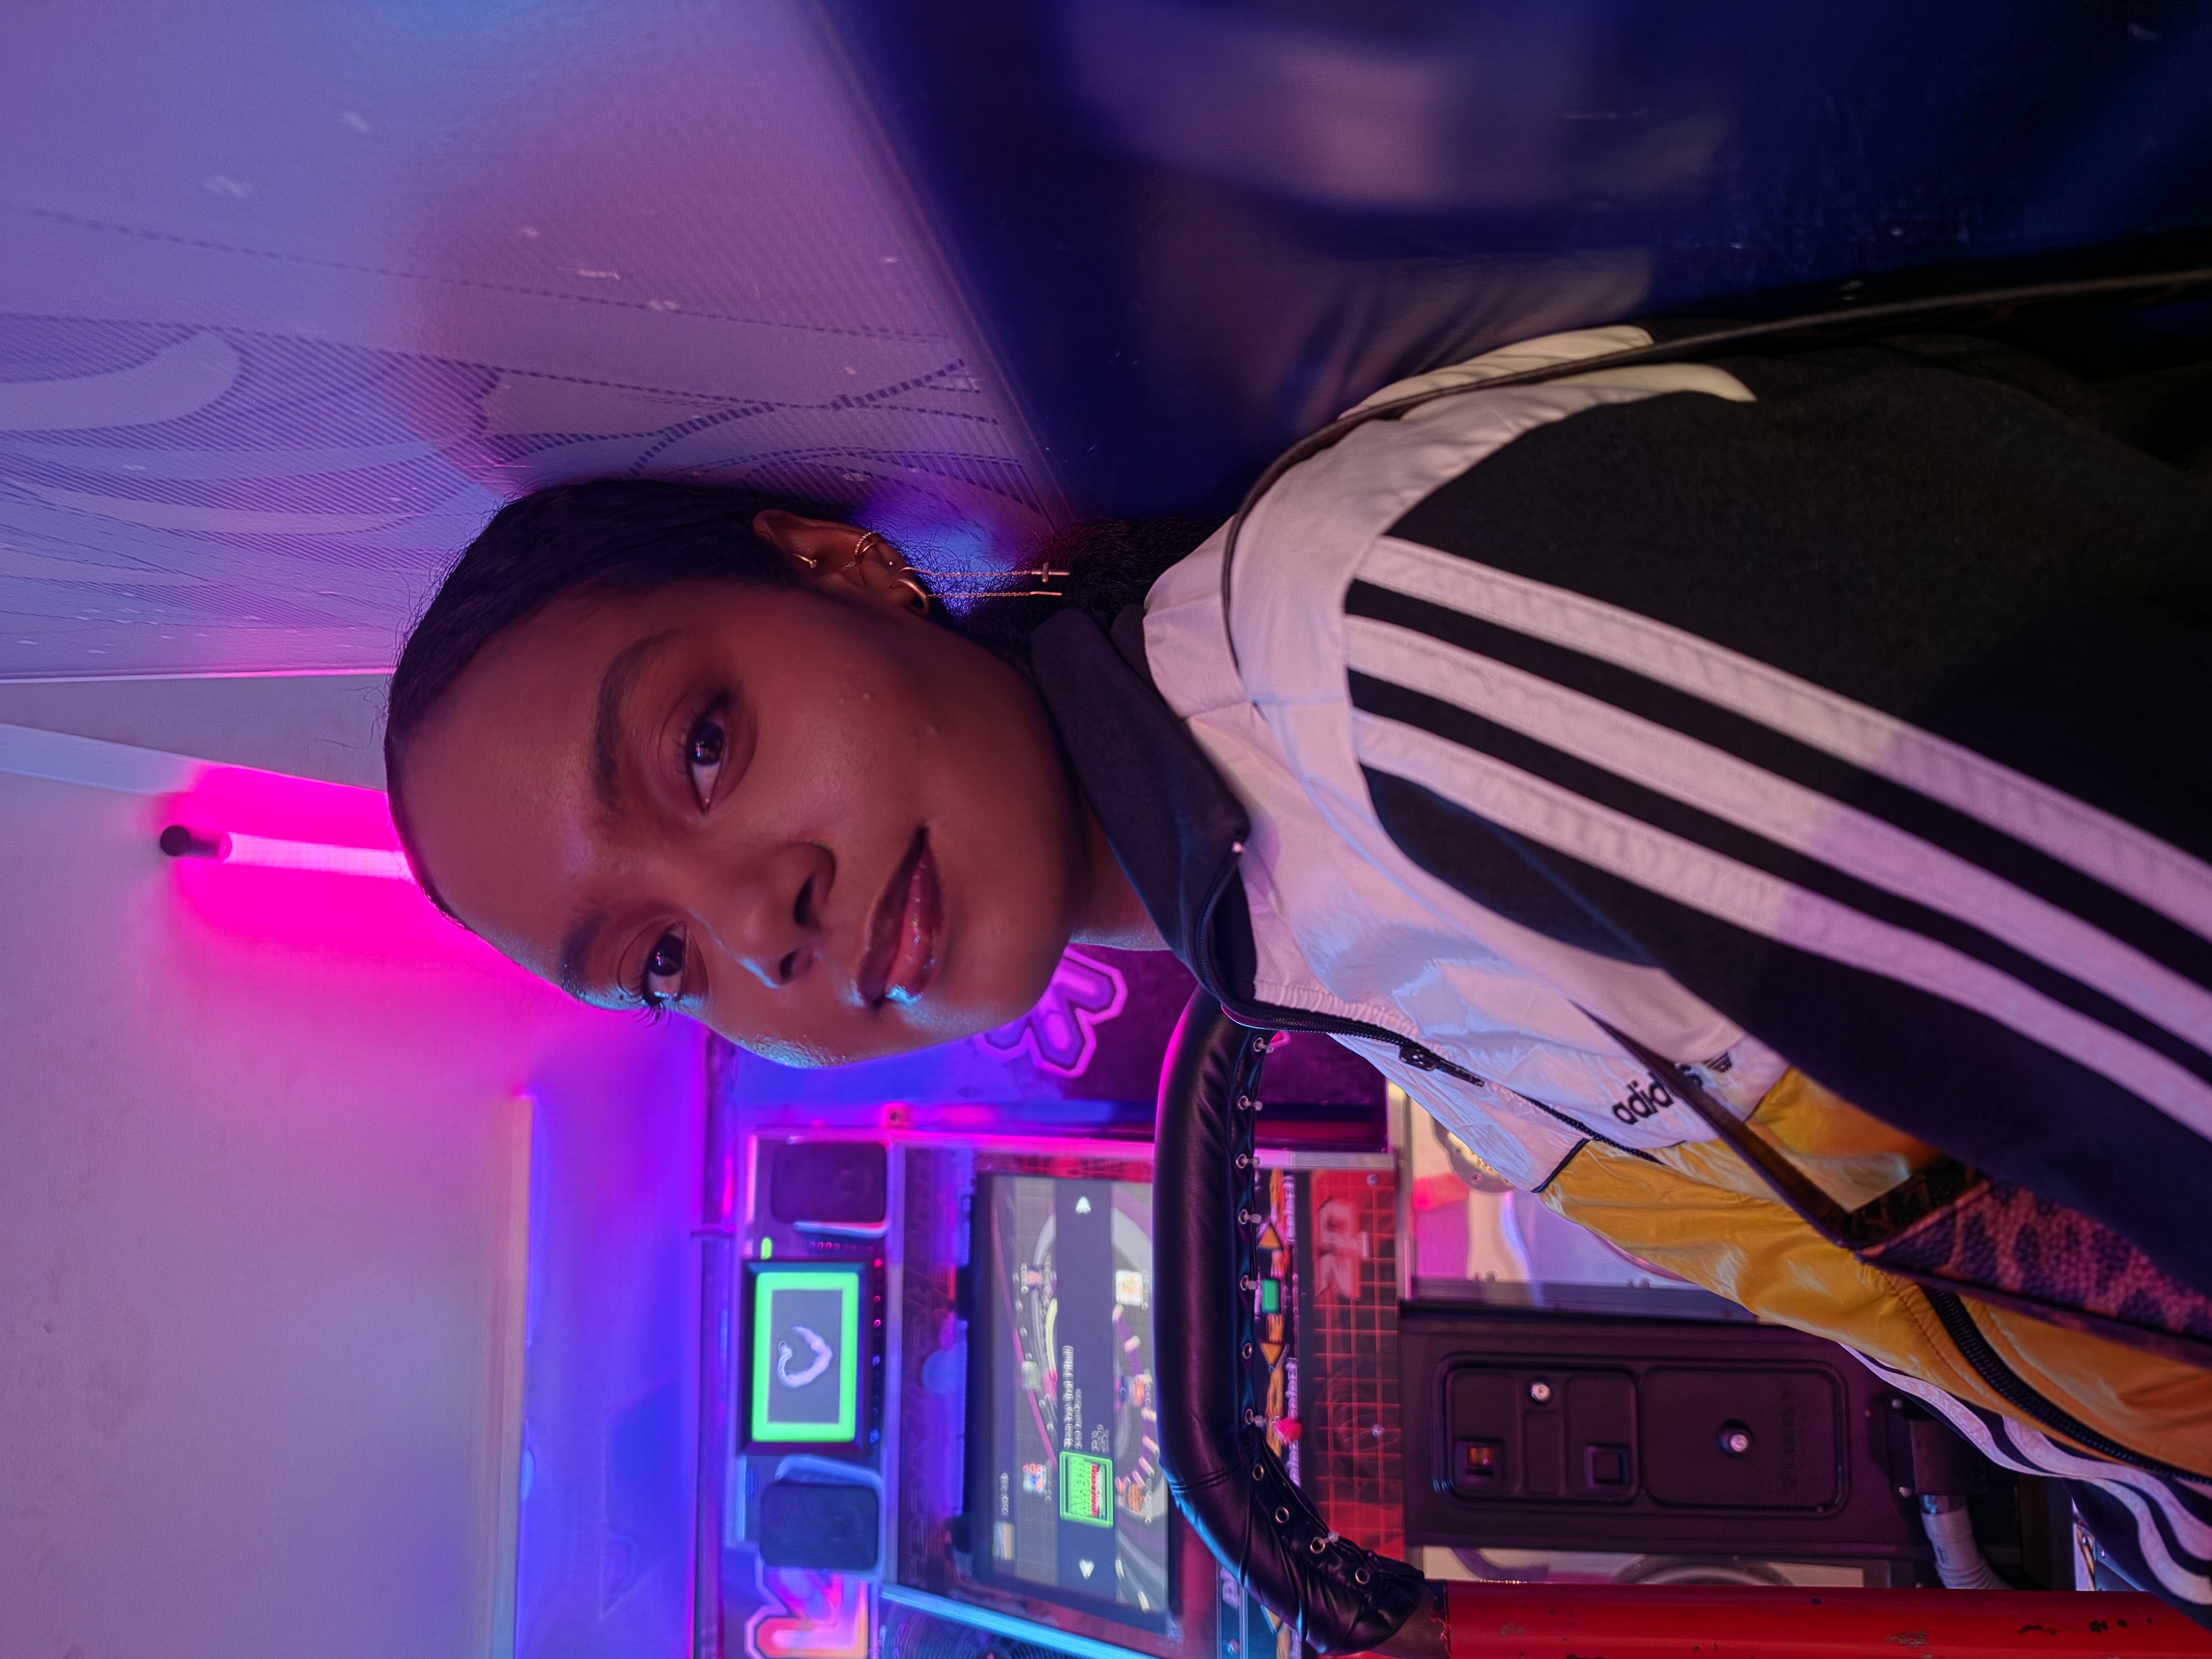
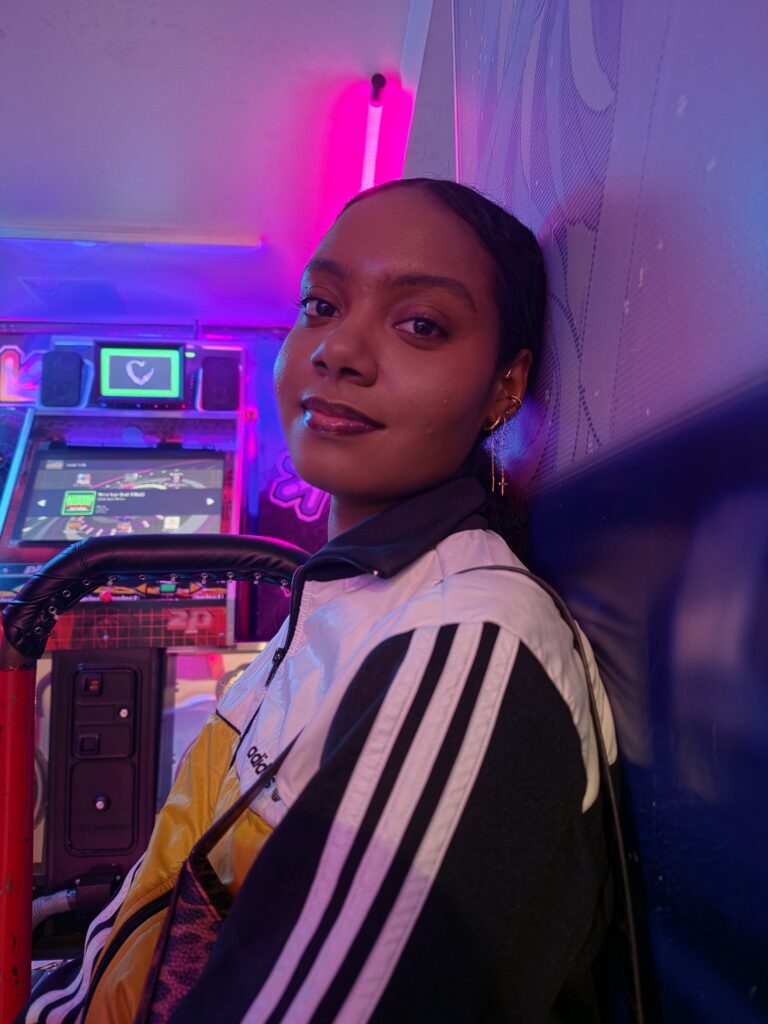
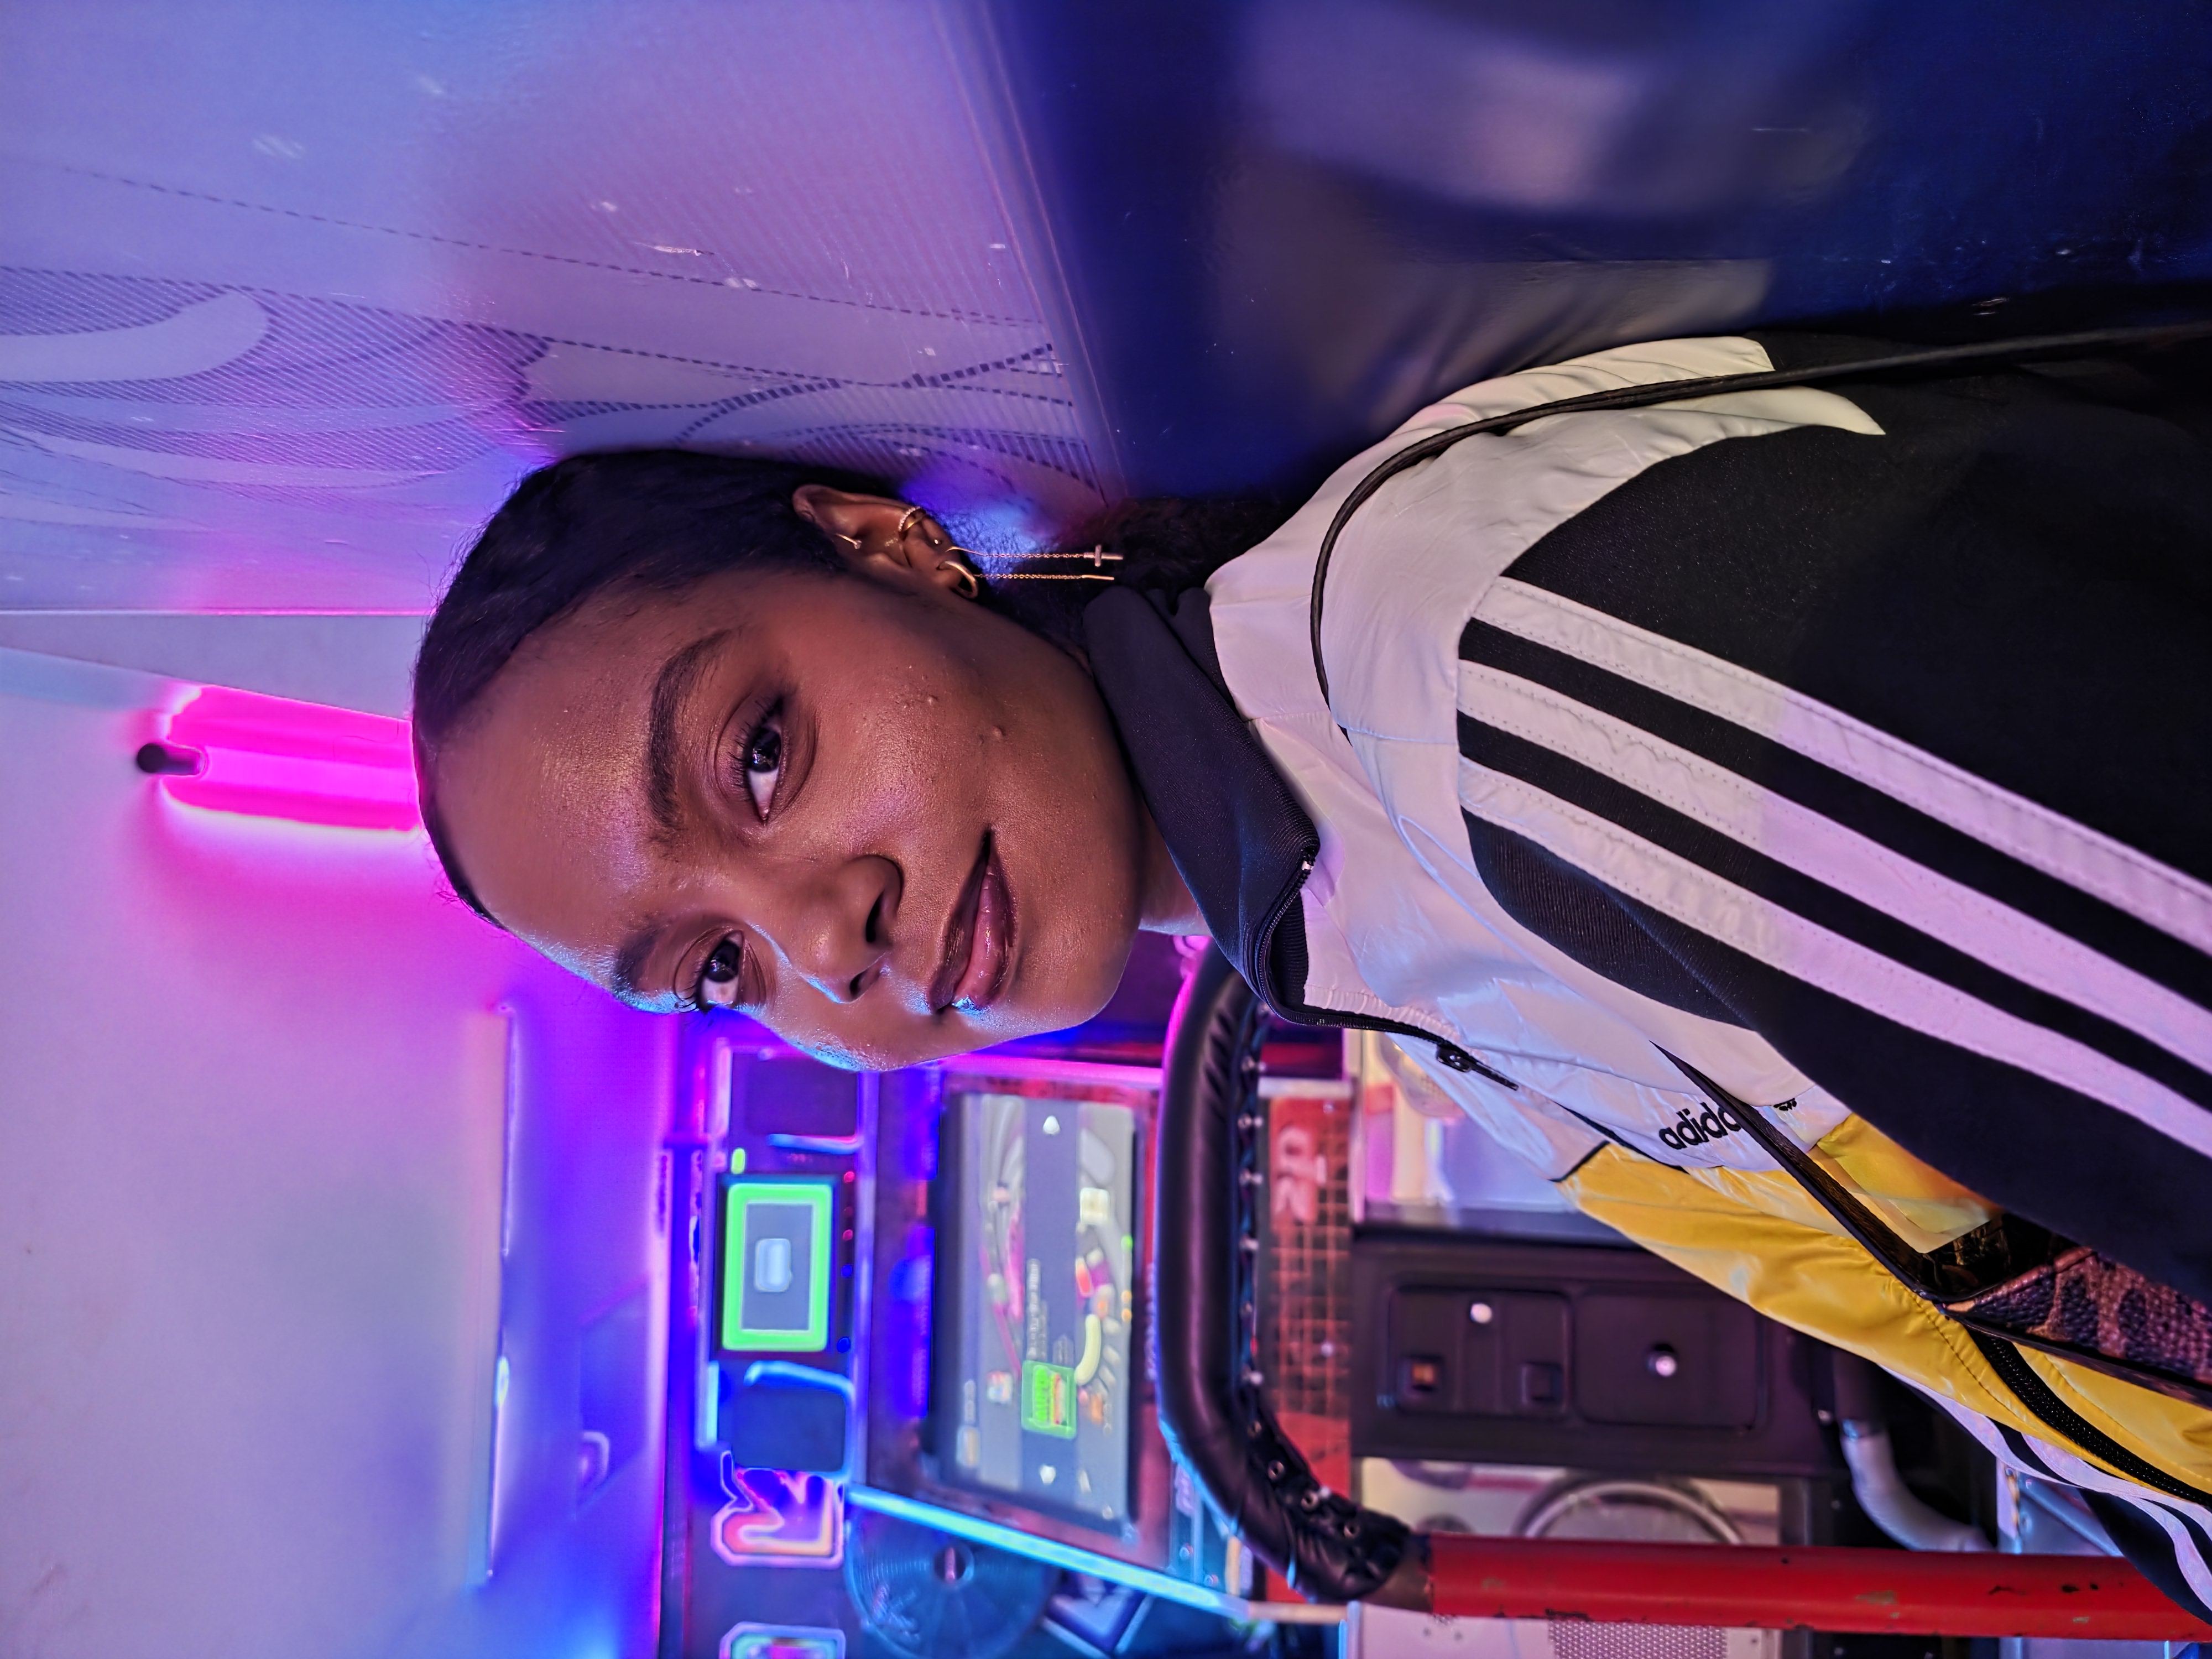
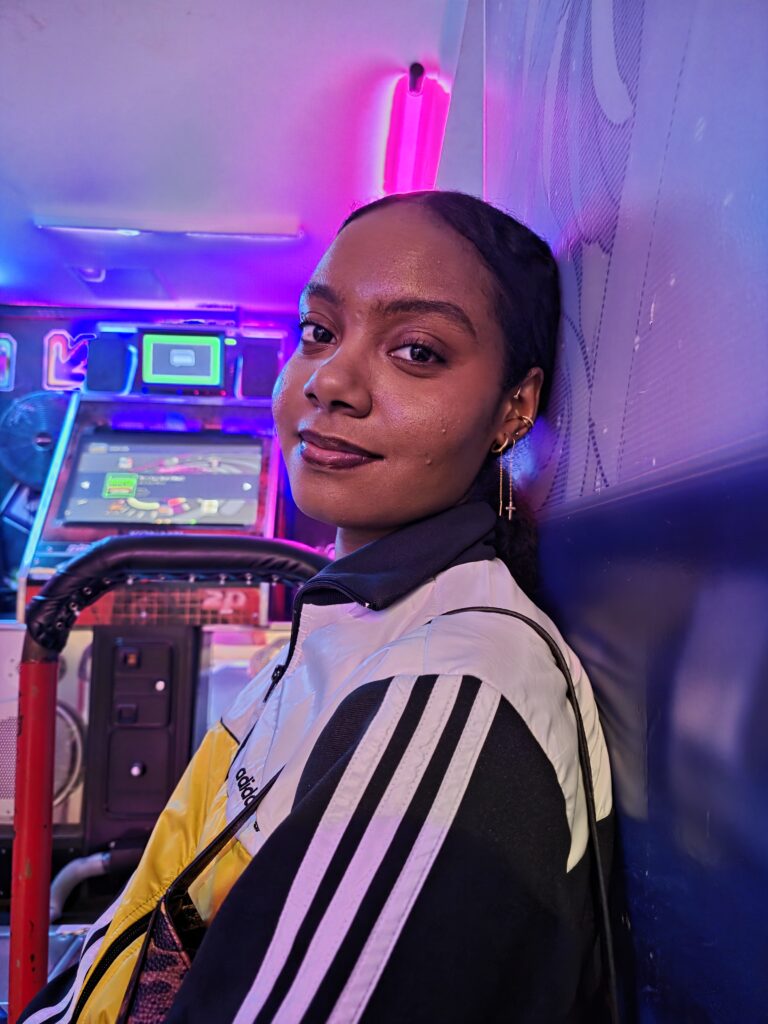
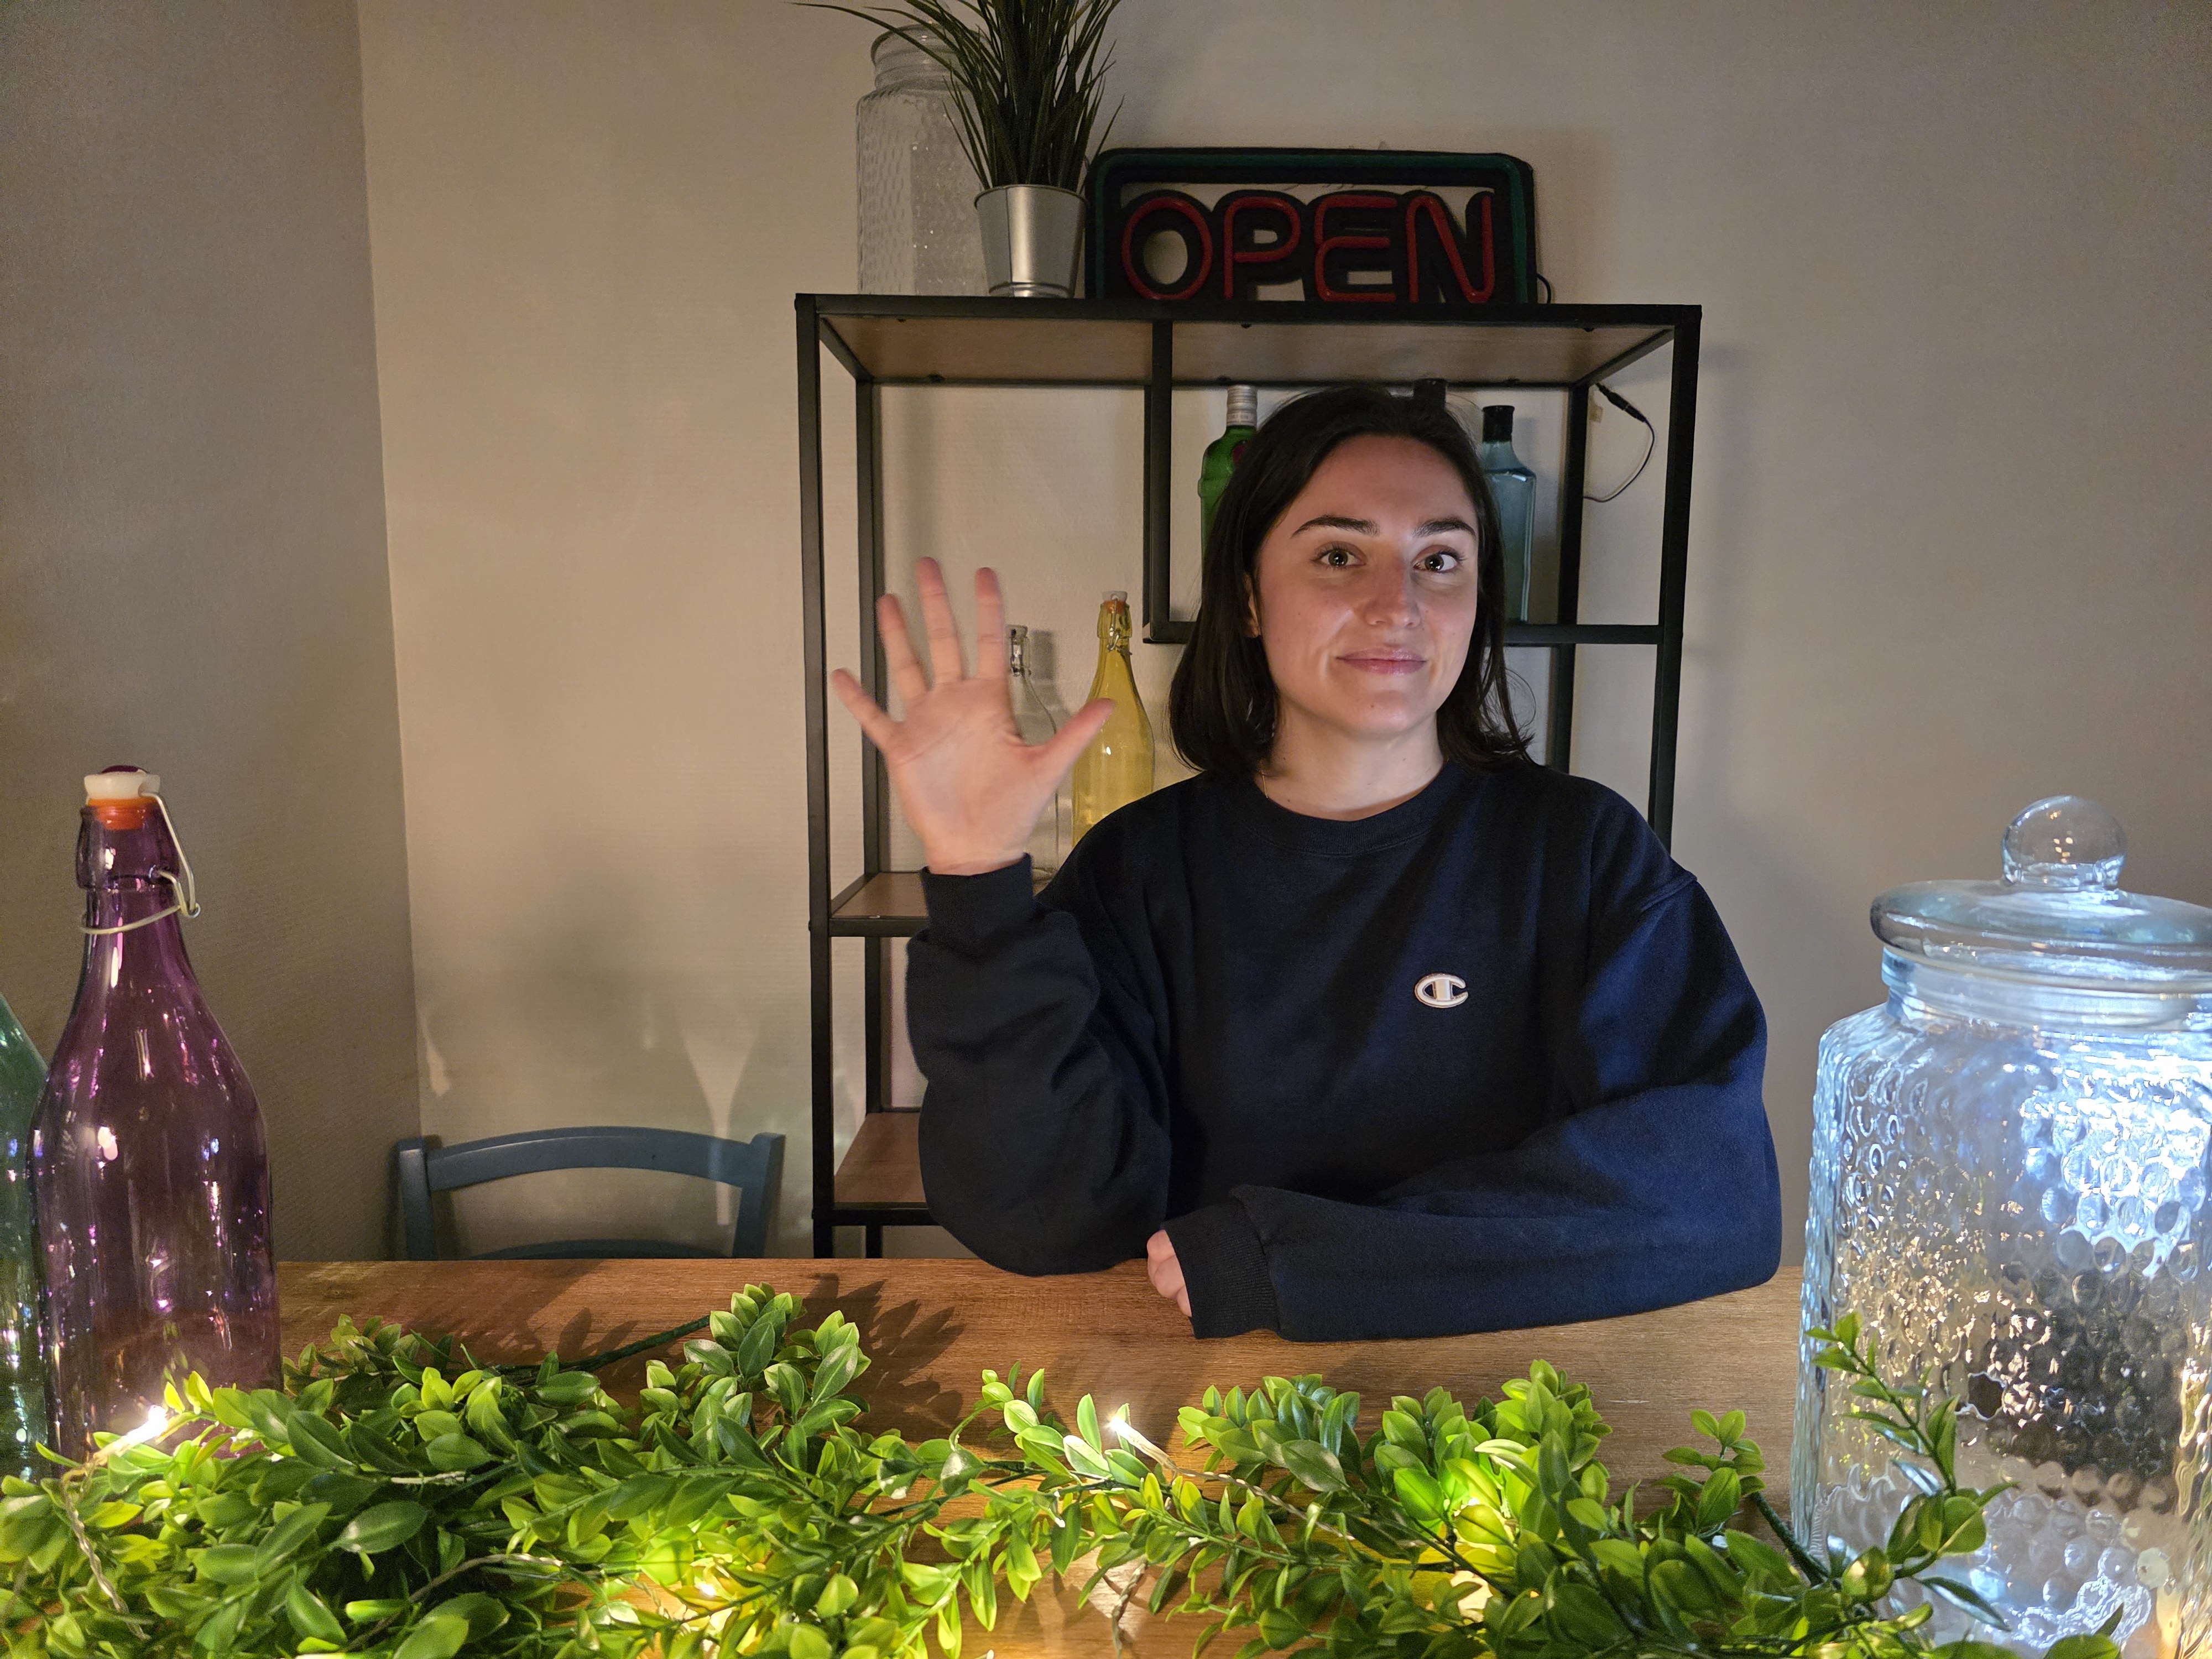
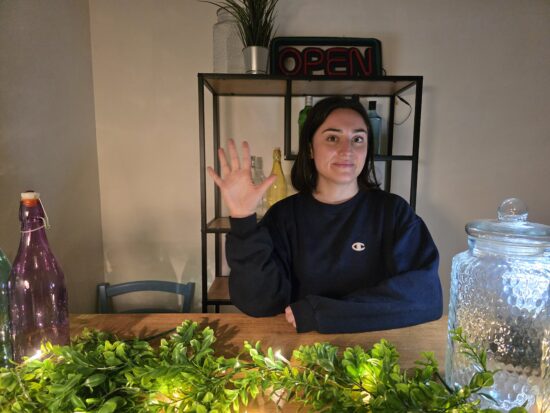
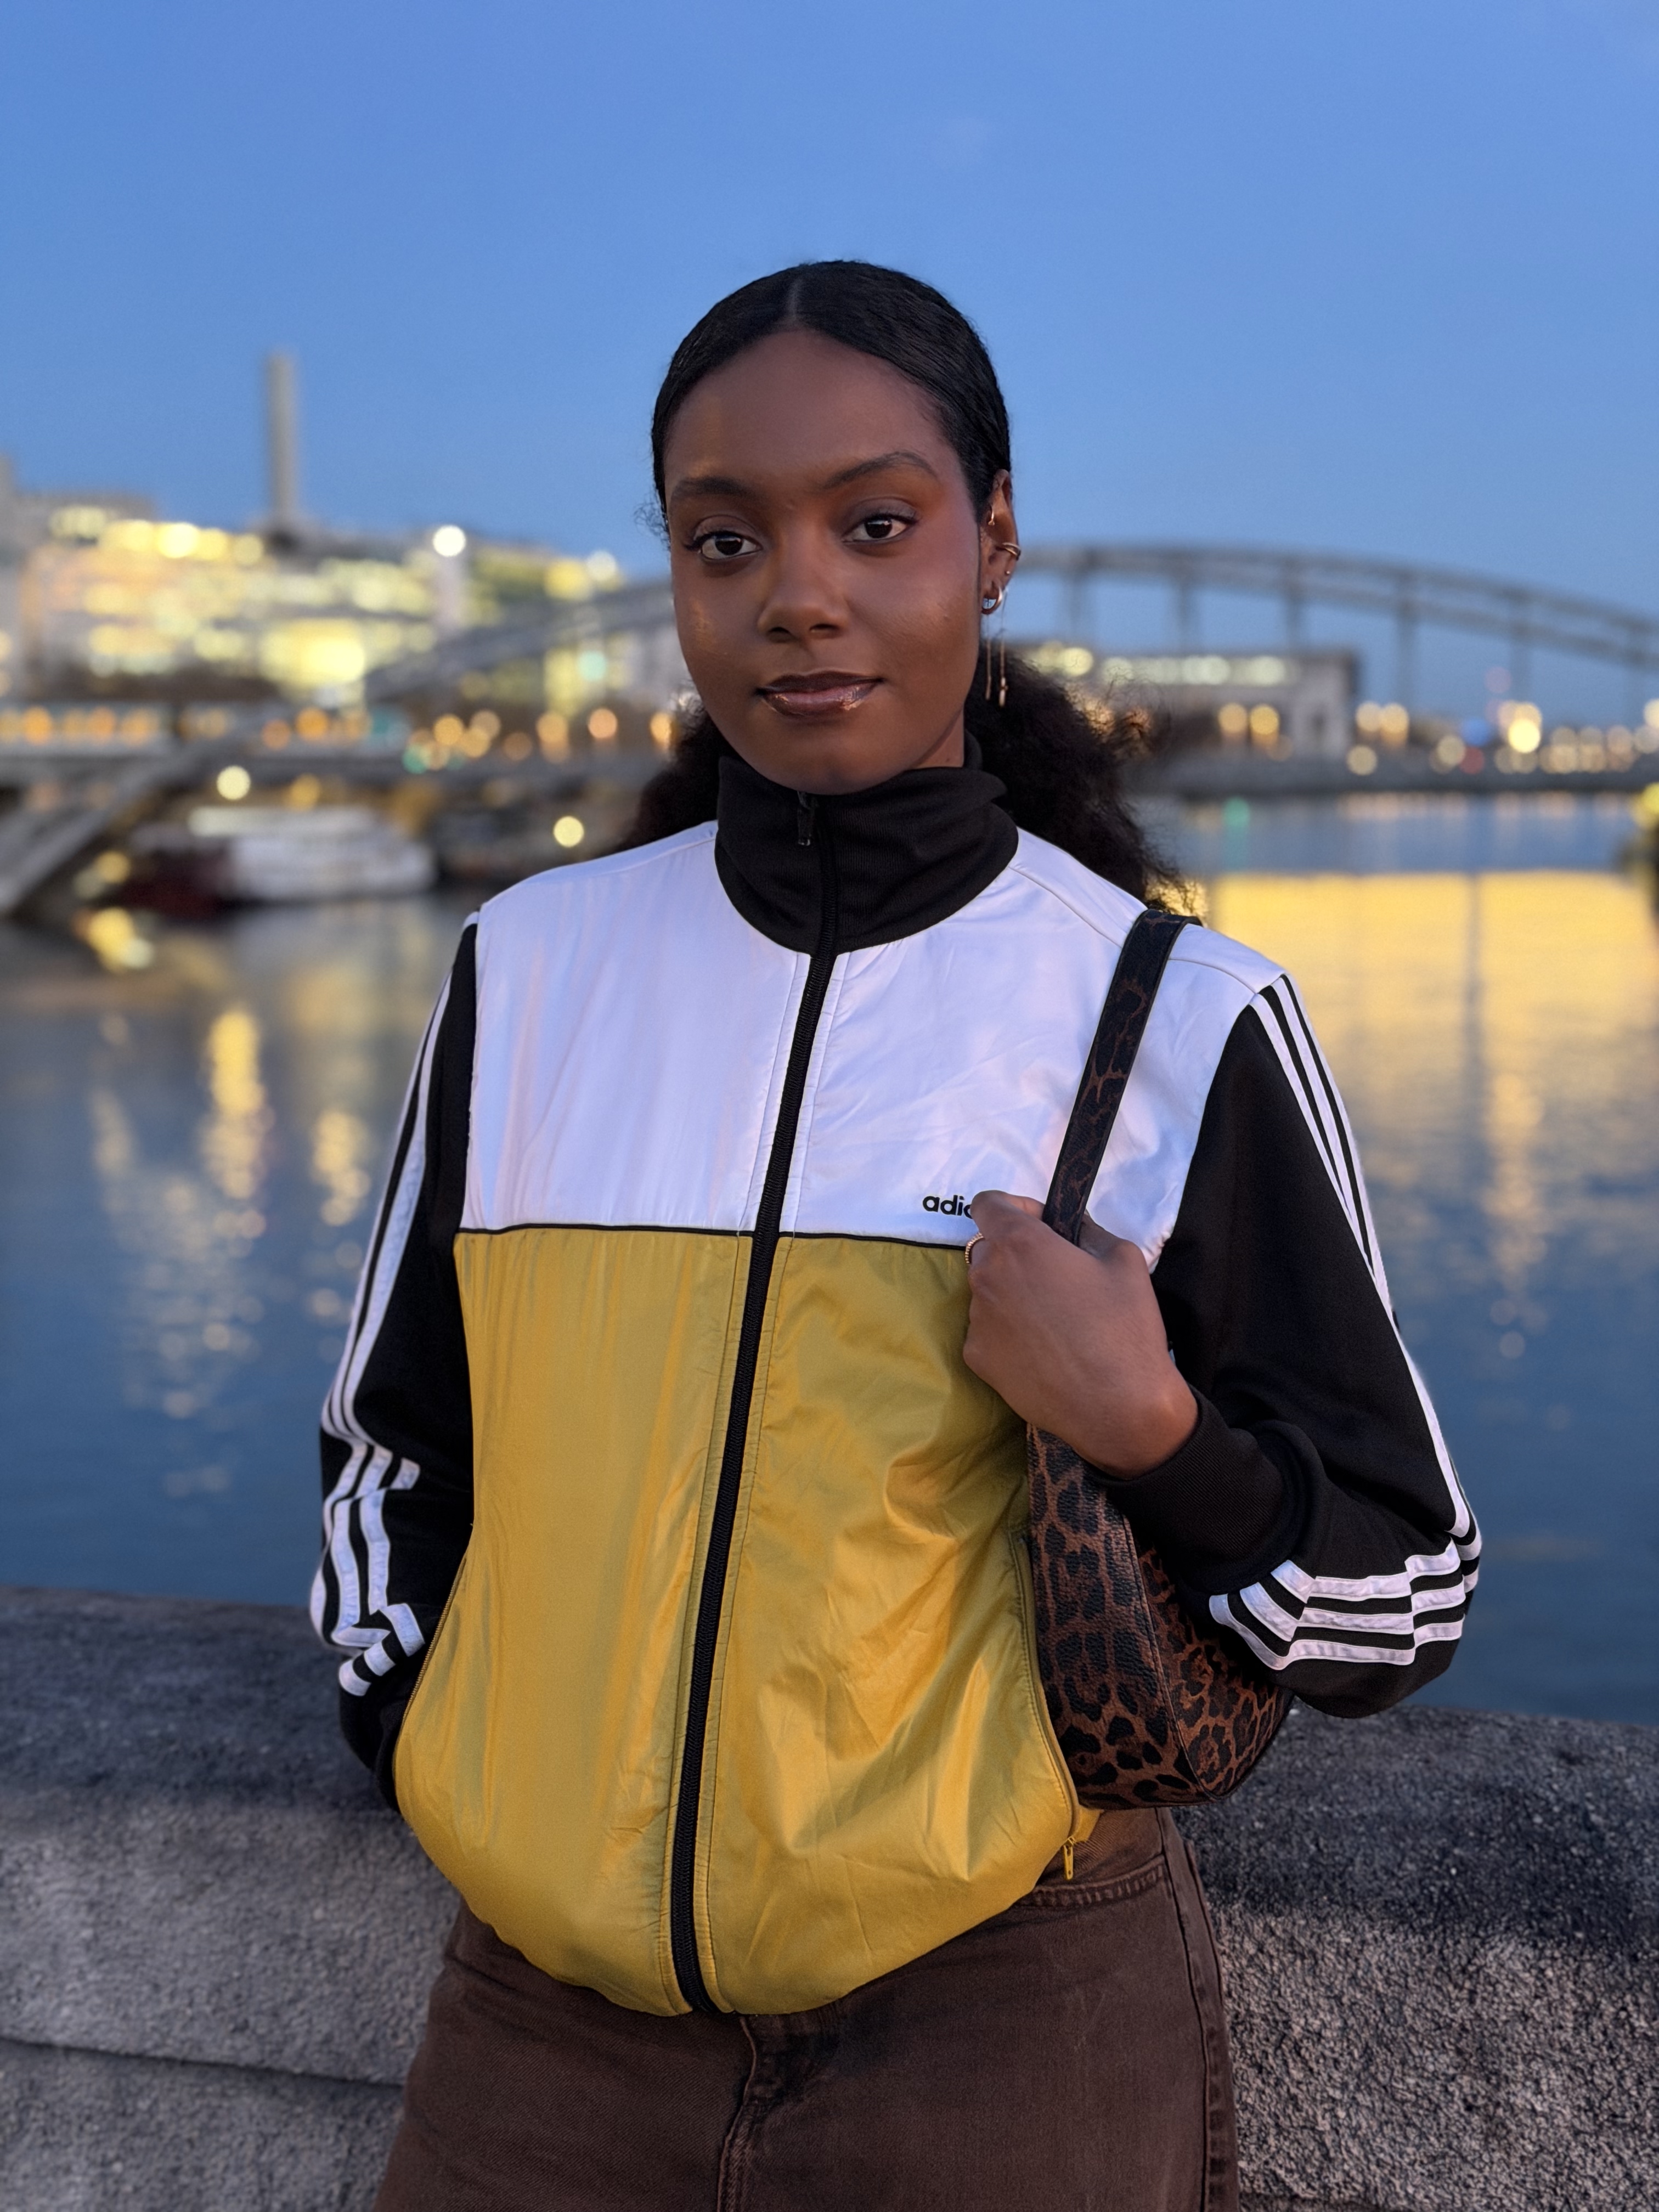
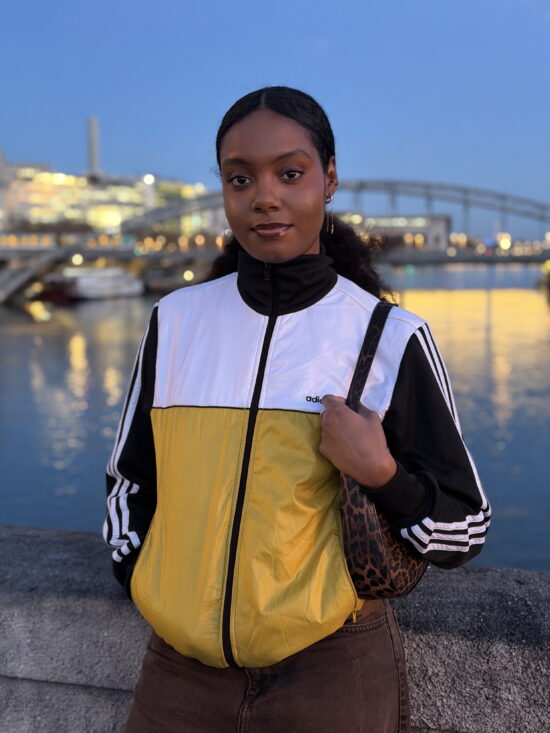
A further benefit of the wider aperture is an improved signal-to-noise ratio in backlit, high-contrast scenes, resulting in cleaner portrait subjects with less noise, better texture, and more accurate colors. Overall, these upgrades allow the S26 Ultra to deliver more reliable performance and better image quality in challenging lighting conditions.
The Samsung Galaxy S26 Ultra offers a refined zoom experience, with the telephoto module delivering cleaner images thanks to improved noise control and more natural rendering — though fine detail capture has slightly decreased compared to the predecessor. Color reproduction has also improved, with more accurate tones and better white balance in natural scenes. Samsung has also addressed several of the sporadic telephoto issues seen on the S25 Ultra, resulting in a more reliable performance overall. The ultra-wide camera benefits from similar noise reduction improvements and produces clean, stable results outdoors, though low-light shooting still suffers from autofocus failures that reduce sharpness and impact wide-angle scores. Overall, the S26 Ultra’s zoom system brings meaningful refinements that enhance consistency and image quality across focal lengths.
Test summary
About DXOMARK Camera tests: DXOMARK’s camera evaluations take place in laboratories and real-world situations using a wide variety of use-cases. The scores rely on objective tests for which the results are calculated directly using measurement software in our laboratory setups, and on perceptual tests where a sophisticated set of metrics allow a panel of image experts to compare aspects of image quality that require human judgment. Testing a smartphone involves a team of engineers and technicians for about a week. Photo and Video quality are scored separately and then combined into an overall score for comparison among the cameras in different devices. For more information about the DXOMARK Camera protocol, click here. More details on smartphone camera scores are available here. The following section gathers key elements of DXOMARK’s exhaustive tests and analyses. Full performance evaluations are available upon request. Please contact us on how to receive a full report.
Samsung Galaxy S26 Ultra Camera Scores
This graph compares DXOMARK photo and video scores between the tested device and references. Average and maximum scores of the price segment are also indicated. Average and maximum scores for each price segment are computed based on the DXOMARK database of devices tested.
For scoring and analysis, DXOMARK engineers capture and evaluate more than 3,800 test images in controlled lab environments as well as outdoor, indoor and low-light natural scenes, using the camera’s default settings. The photo protocol is designed to take into account the main use cases and is based on typical shooting scenarios, such as portraits, landscape and zoom photography. The evaluation is performed by visually inspecting images against a reference of natural scenes, and by running objective measurements on images of charts captured in the lab under different lighting conditions from 0.1 to 10,000+ lux and color temperatures from 2,300K to 6,500K.
The photo Main tests analyze image quality attributes such as exposure, color, texture, and noise in various light conditions. Autofocus performances and the presence of artifacts on all images captured in controlled lab conditions and in real-life images are also evaluated. All these attributes have a significant impact on the final quality of the images captured with the tested device and can help to understand the camera's main strengths and weaknesses at 1x.
The Samsung Galaxy S26 Ultra delivers a noticeable step forward in several key photo attributes, thanks to a wider aperture on the primary camera module and an updated image processing pipeline. The most significant gains come in color, where white balance is generally more accurate and skin tones are nicely rendered, as well as in texture and noise trade-off, which shows clear progress across most lighting conditions.
However, some of the shortcomings observed on the previous model persist. The exposure score remains unchanged, due to instabilities between consecutive shots that make results somewhat unpredictable in challenging scenes. Contrast handling in high-contrast scenes also remains an area of concern, with backgrounds often appearing flat.
While the improvements in detail retention and noise reduction are welcome, the S26 Ultra still lags behind some high-end competitors in those categories. Noise remains noticeable, particularly when shooting indoors or in low light, and fine detail is not always rendered at the level expected from a flagship device. As a result, the S26 Ultra shows solid progress but stops short of fully closing the gap to the best-in-class devices.
Close-Up
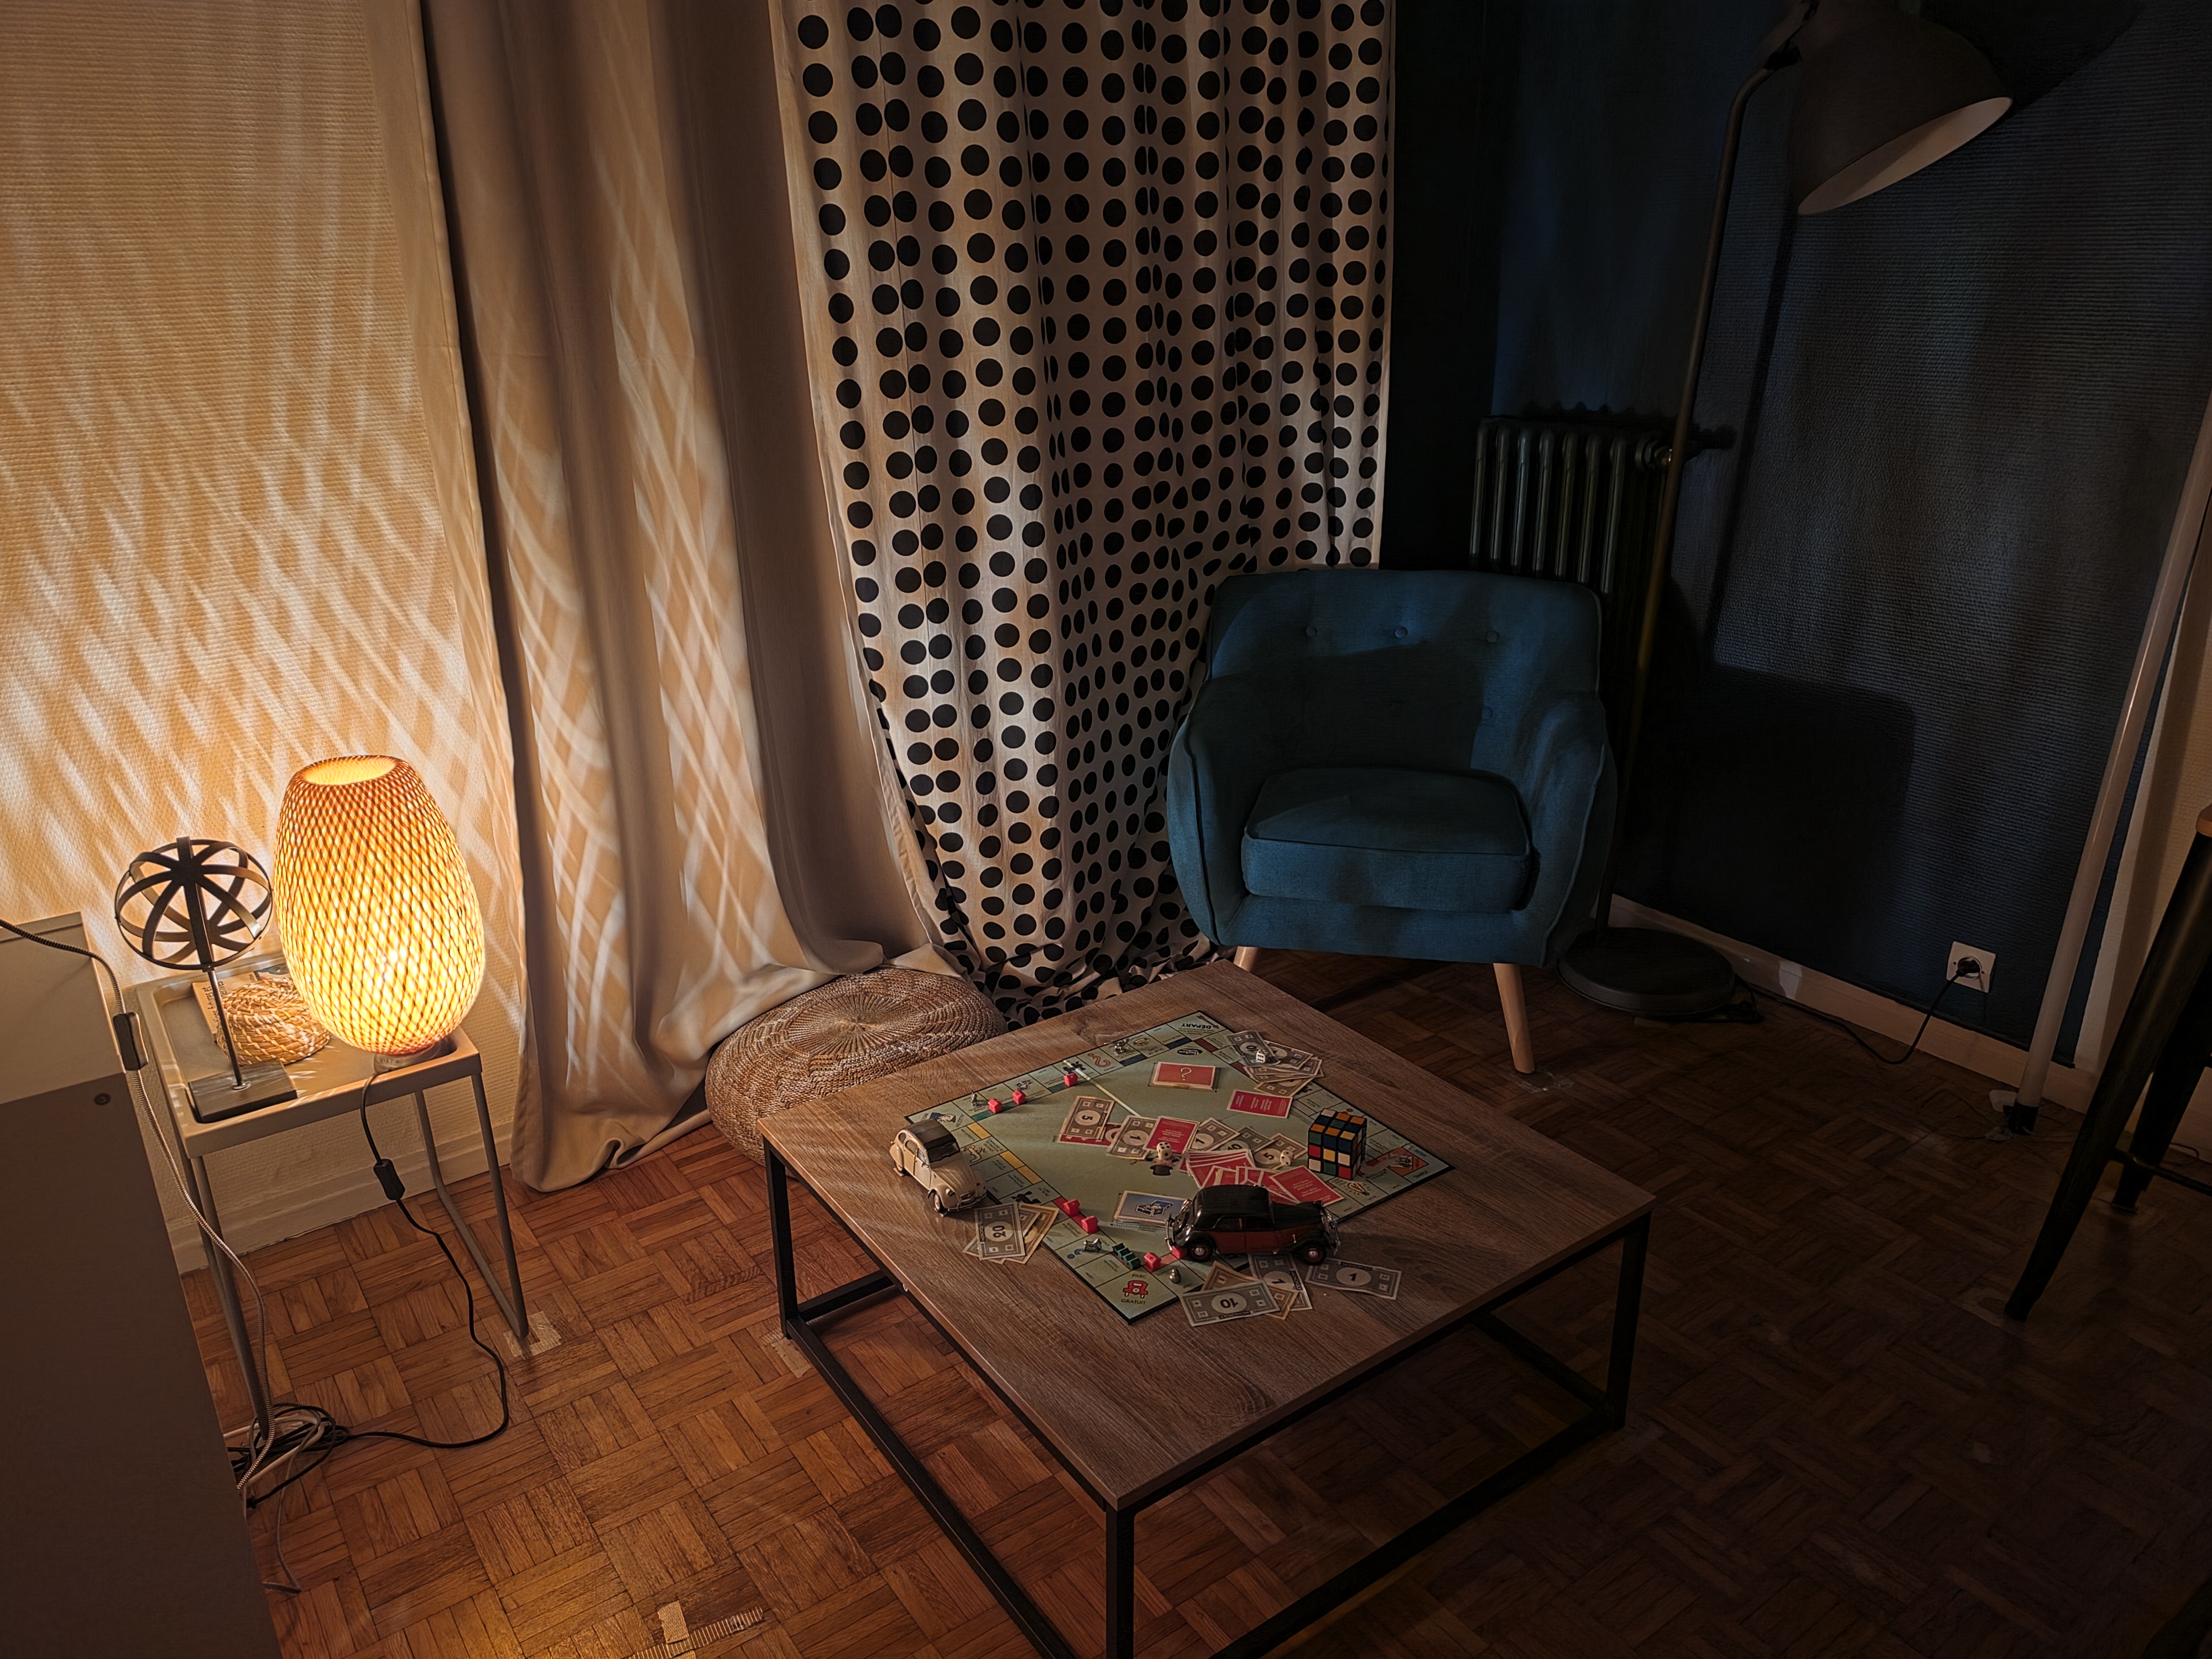
The Galaxy S26 Ultra’s close-up performance meets top-end flagship expectations, delivering high levels of detail and accurate colors in both indoor and outdoor scenes. However, in dimmer conditions, image quality is affected by noticeable noise.
Samsung Galaxy S26 Ultra – High levels of detail, accurate white balance
Samsung Galaxy S25 Ultra – High levels of detail, slightly cold cast
Apple iPhone 17 Pro – Good detail, blue color cast
Brightness on face with illuminance levels (Diana)
These graphs represent the output level on the face measured on the images captured by the device under test in multiple lighting conditions on the AFHDR Portrait setup. We show here the intensity measured on the forehead of the realistic mannequin, for a picture displayed on a HDR monitor in standard ISO/TS 22028-5 playback conditions. The multiple lighting conditions of the scene are characterized by the illumination level in lux and the relative brightness of the backlit panel simulating high dynamic range conditions. Delta EV specifies the difference of luminance in stops between the face and the light panel simulating HDR conditions. The intensity is measured in JND derived from the ICtCp color space.
Brightness on face with illuminance levels (Eugene)
These graphs represent the output level on the face measured on the images captured by the device under test in multiple lighting conditions on the AFHDR Portrait setup. We show here the intensity measured on the forehead of the realistic mannequin, for a picture displayed on a HDR monitor in standard ISO/TS 22028-5 playback conditions. The multiple lighting conditions of the scene are characterized by the illumination level in lux and the relative brightness of the backlit panel simulating high dynamic range conditions. Delta EV specifies the difference of luminance in stops between the face and the light panel simulating HDR conditions. The intensity is measured in JND derived from the ICtCp color space.
Exposure is one of the key attributes for technically good pictures. The main attribute evaluated is the brightness level of the main subject through various use cases such as landscape, portrait, or still life. Other factors evaluated are the global contrast and the ability to render the dynamic range of the scene (ability to render visible details in both bright and dark areas). When the camera provides Photo HDR format, the images are analyzed with a visualization on an HDR reference monitor, under reference conditions specified in the ISO-22028-5 standard. Repeatability is also important because it demonstrates the camera's ability to provide the same rendering when shooting several images of the same scene.
The Galaxy S26 Ultra delivers good exposure performance in lab testing, with solid target accuracy and wide dynamic range. The camera typically aims for a bright overall rendering, but remains well within acceptable limits, giving images a distinctive look. Dynamic range is a notable strength, with good highlight retention in both lab and real-life scenes.
That said, some limitations persist. Our experts observed exposure inconsistencies across several conditions, particularly in low-light and backlit scenes, where brightness can vary noticeably between consecutive shots. Contrast handling in very bright areas of the frame is also an issue, as highlight tone compression can produce flat, unrealistic-looking spots in the brightest parts of the image.
Color is one of the key attributes for technically good pictures. The image quality attributes analyzed are skin-tone rendering, white balance, color shading, and repeatability. For color and skin tone rendering, we penalize unnatural colors according to results gathered in various studies and consumer insights while respecting the manufacturer's choice of color signature.
Color is one of the areas where the Galaxy S26 Ultra shows the most significant improvement over its predecessor. The device offers a well-balanced white balance response across nearly all test scenes, resulting in a strong overall color score that places it close to the category leaders. White balance is a standout strength, remaining accurate across a wide range of conditions — from backlit outdoor scenes to artificial low-light environments. The S26 Ultra also delivers pleasing, natural skin tones in most situations.
Some limitations remain, however, particularly in scenes where the subject is positioned in the brightest parts of the frame. In these situations, highlight color compression can result in occasional skin tone inaccuracies. Additionally, skies are sometimes rendered with a slight tendency toward muted or greyish tones. That said, these issues occur primarily in demanding high-brightness scenarios and are common across most devices.
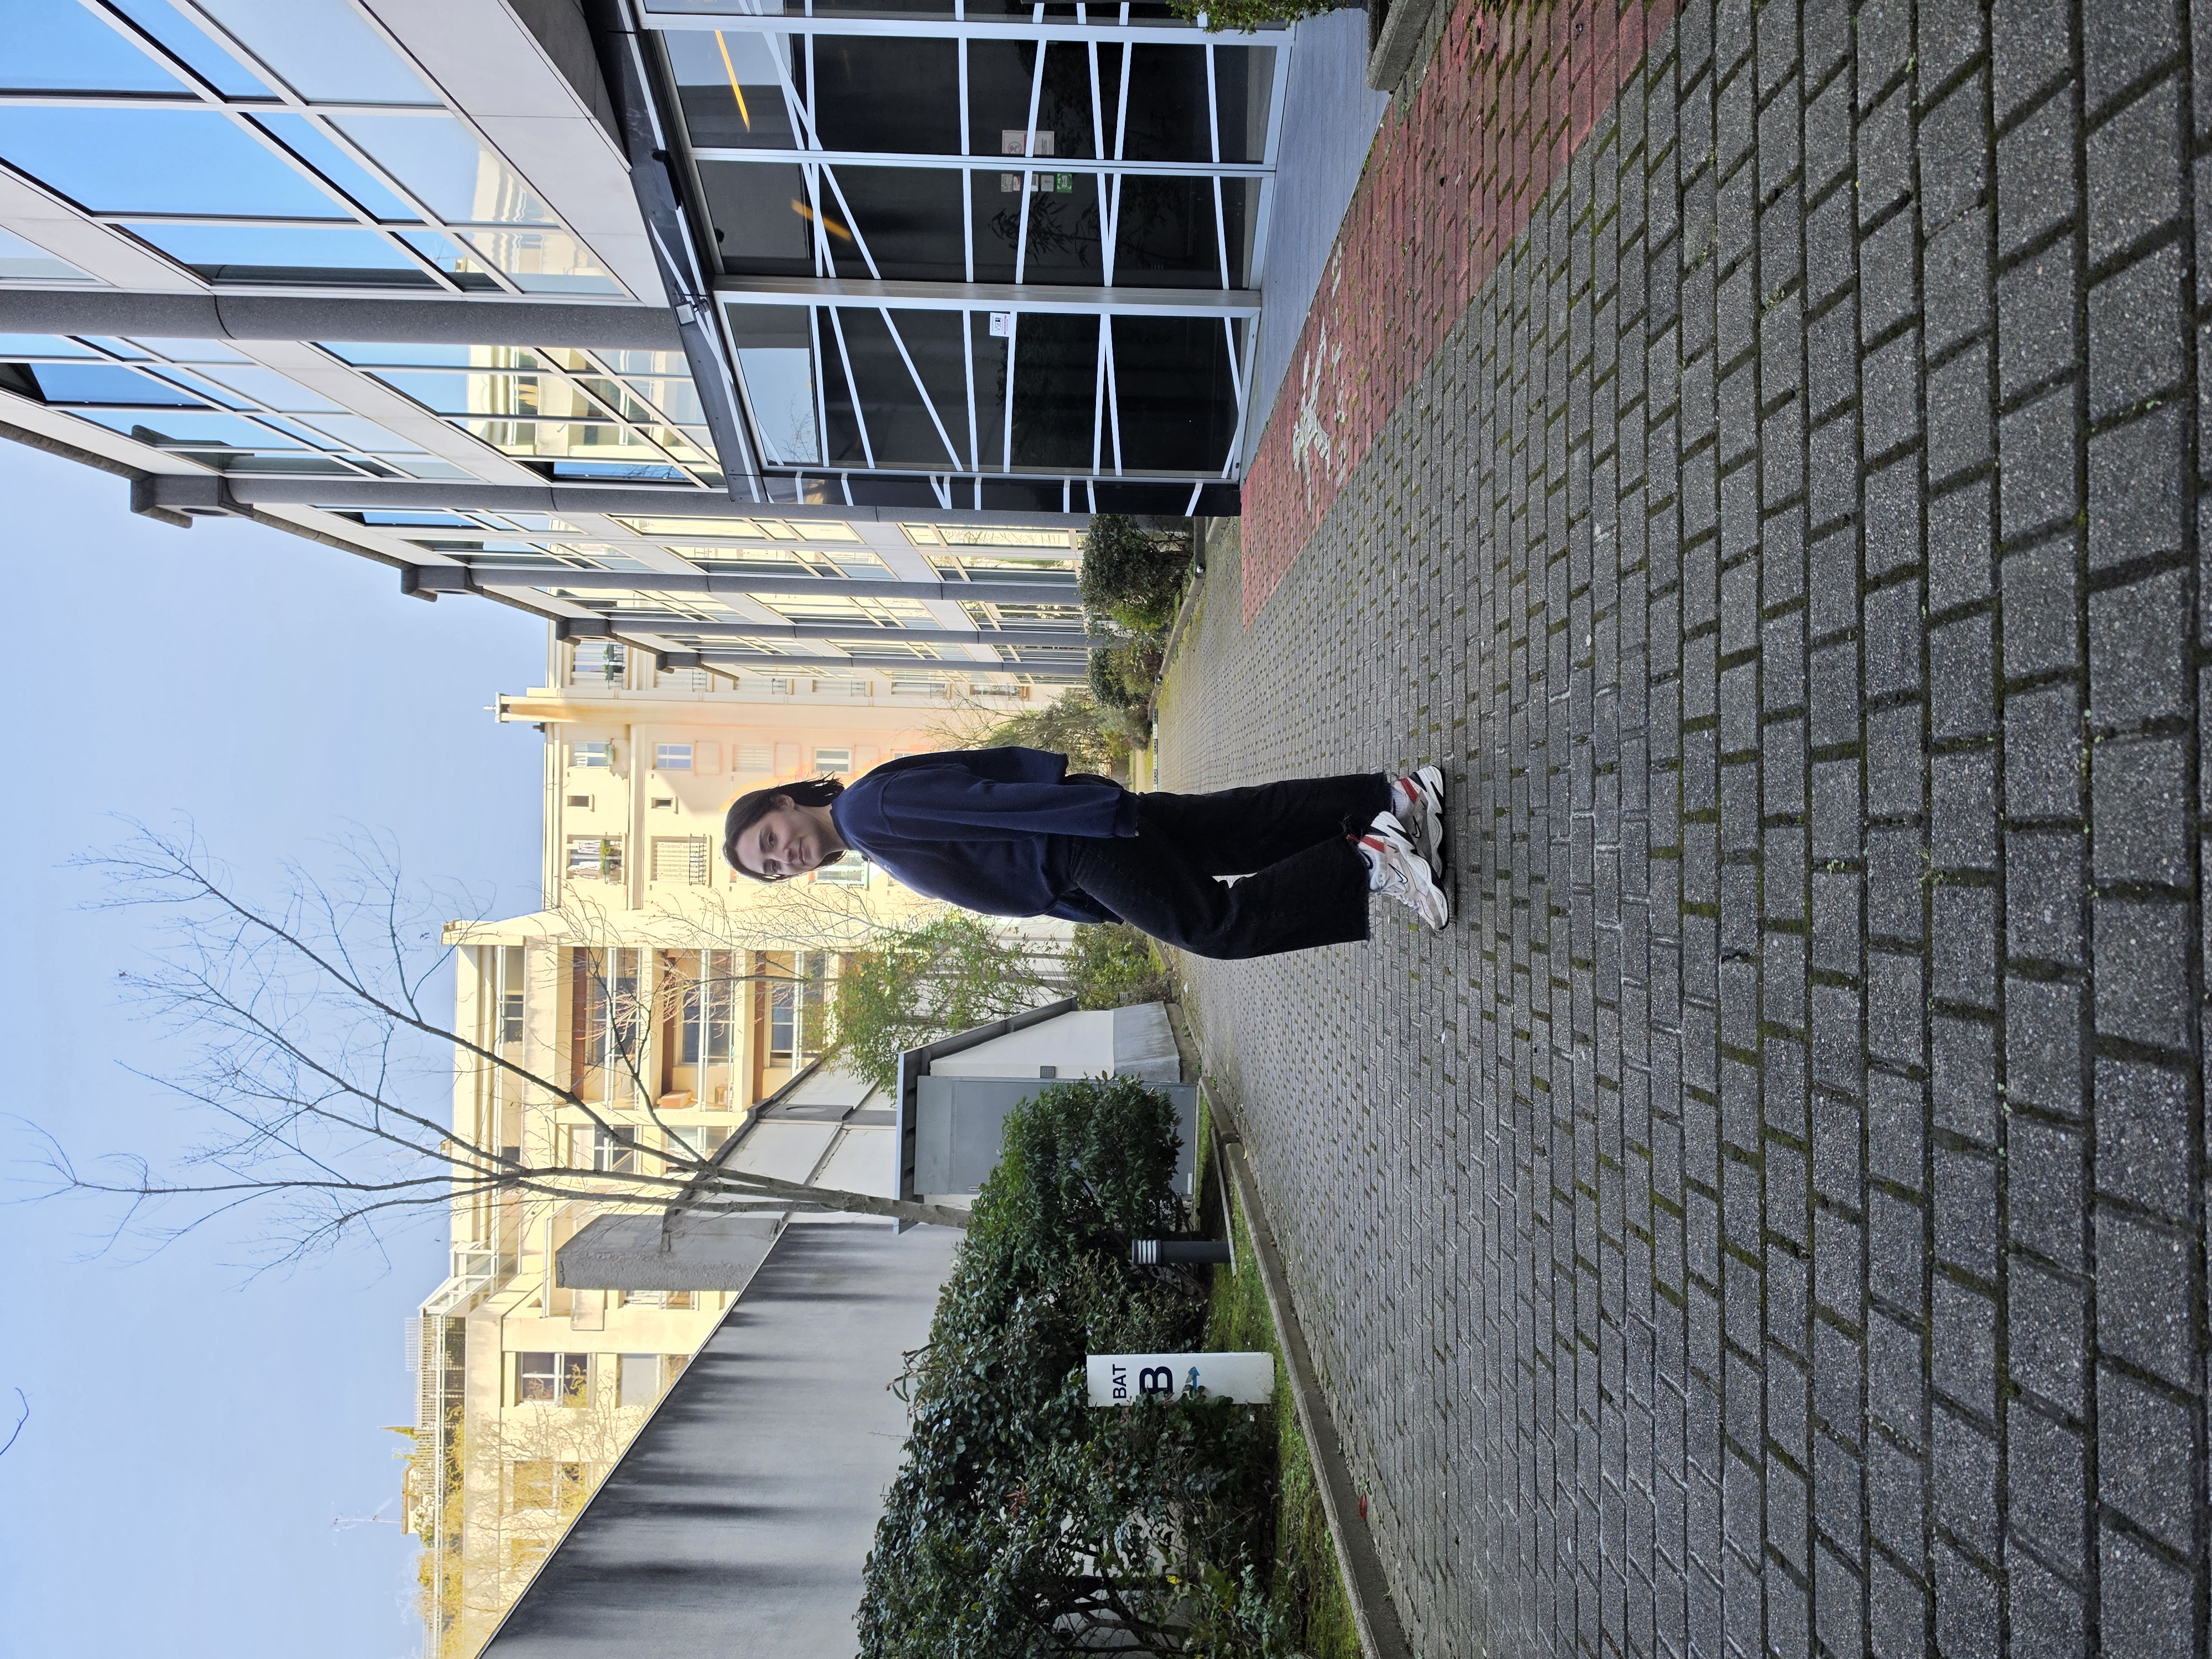
Samsung Galaxy S26 Ultra – Nice colors and skin tones
Samsung Galaxy S25 Ultra – Nice colors and skin tones
Apple iPhone 17 Pro – Nice colors and skin tones, slightly darker exposure on background face
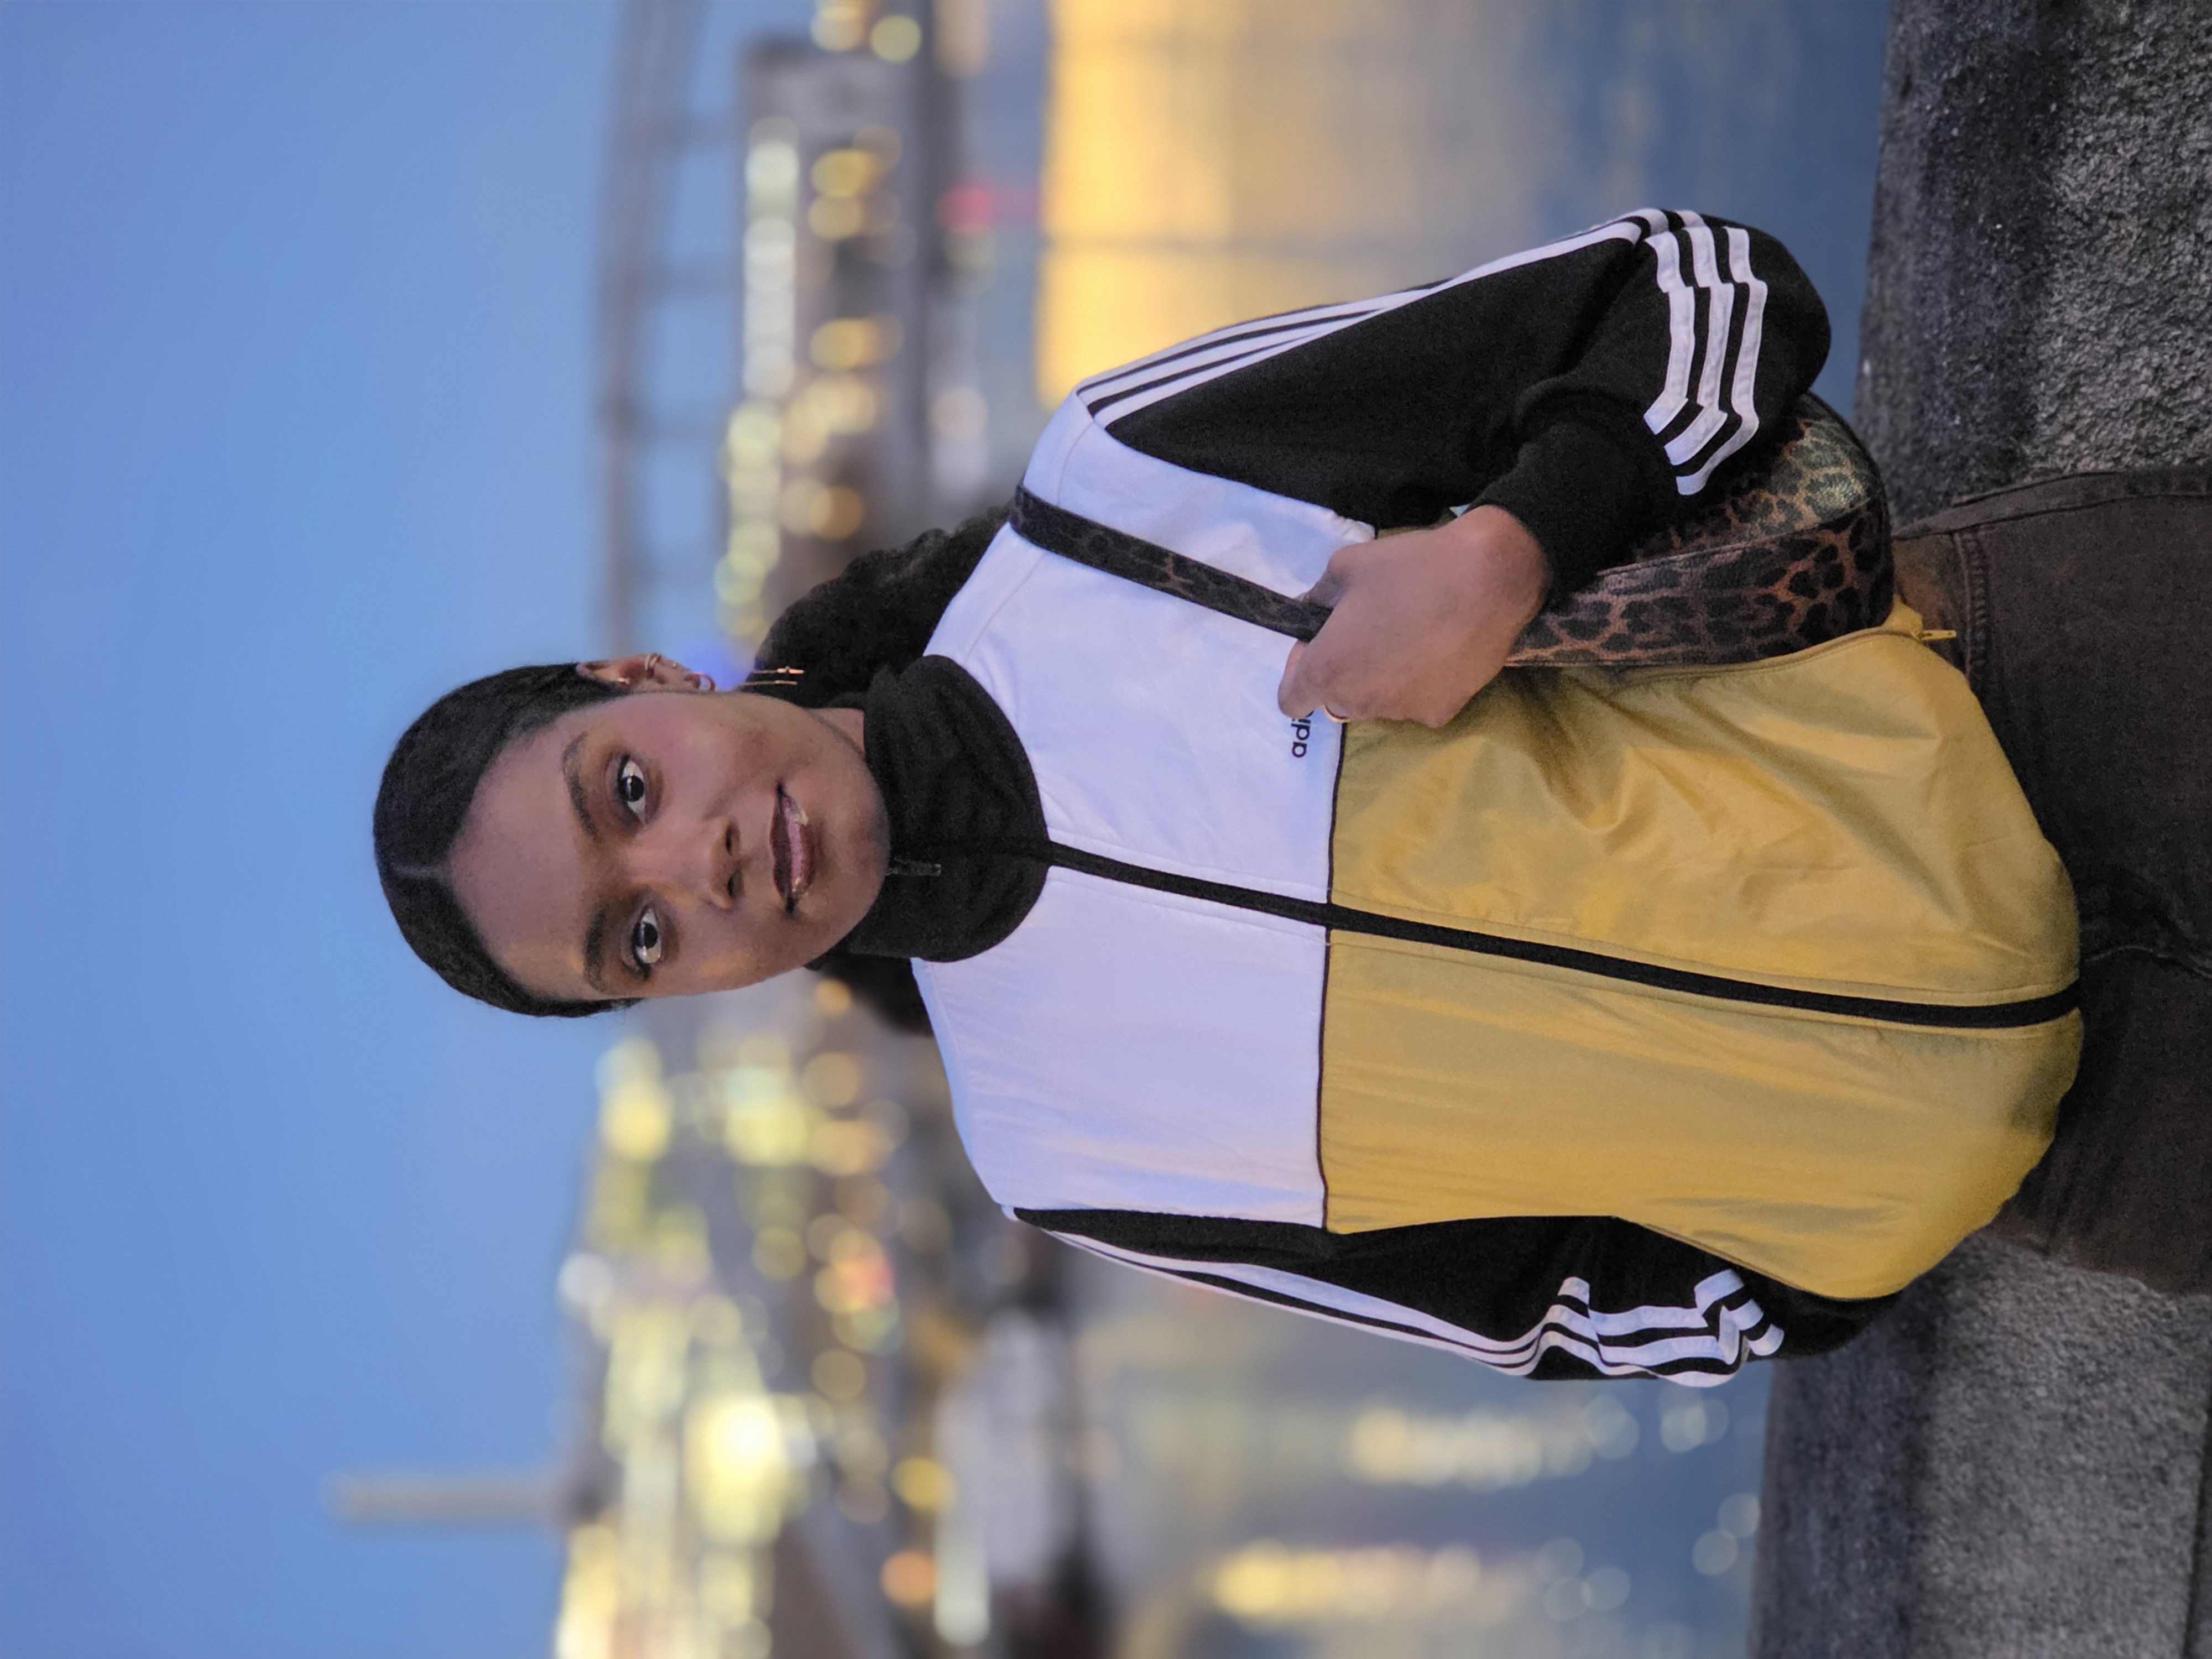
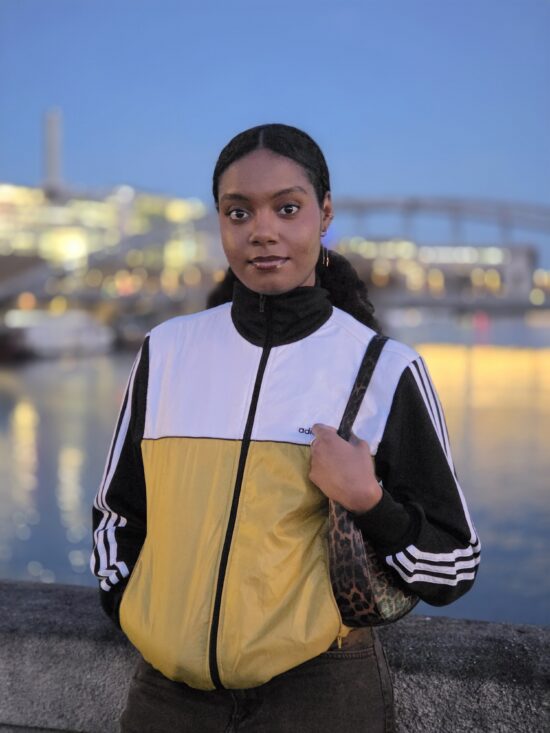
Samsung Galaxy S26 Ultra – Neutral white balance and pleasant skin tones
Samsung Galaxy S25 Ultra – Yellow-green white balance cast
Apple iPhone 17 Pro – Warm white balance and pleasant skin tones
Autofocus tests concentrate on focus accuracy, focus repeatability, shooting time delay, and depth of field. Shooting delay is the difference between the time the user presses the capture button and the time the image is actually taken. It includes focusing speed and the capability of the device to capture images at the right time, what is called 'zero shutter lag' capability. Even if a shallow depth of field can be pleasant for a single subject portrait or close-up shot, it can also be a problem in some specific conditions such as group portraits; Both situations are tested. Focus accuracy is also evaluated in all the real-life images taken, from infinity to close-up objects and in low light to outdoor conditions.
Autofocus irregularity and speed: 1000Lux Δ0EV Daylight Handheld
This graph illustrates focus accuracy and speed as well as zero shutter lag capability by showing the edge acutance versus the shooting time measured on the AFHDR setup on a series of pictures. All pictures were taken in one light condition and indicated illuminant, 500ms after the defocus. The edge acutance is measured on the four edges of the Dead Leaves chart, and the shooting time is measured on the LED Universal Timer.
Autofocus irregularity and speed: 5Lux Δ0EV Tungsten Handheld
This graph illustrates focus accuracy and speed as well as zero shutter lag capability by showing the edge acutance versus the shooting time measured on the AFHDR setup on a series of pictures. All pictures were taken in one light condition and indicated illuminant, 500ms after the defocus. The edge acutance is measured on the four edges of the Dead Leaves chart, and the shooting time is measured on the LED Universal Timer.
In laboratory testing, the Galaxy S26 Ultra demonstrates fast and reliable autofocus in bright light, achieving quick AF lock with good accuracy. In low-light conditions, however, there is a noticeable capture delay of 0.5 to 1.5 seconds between the shutter press and actual capture, which can result in missed shot opportunities. Despite the slowdown in dim conditions, autofocus precision remains generally solid, with only minor issues observed in real-life scenes.
Samsung Galaxy S26 Ultra
Autofocus failure, low brightness on face and low level of detail preservation
Samsung Galaxy S25 Ultra
Sharp and bright portrait
One additional factor affecting the focus score is the shallow depth of field. In group shots, typically only the subject closest to the camera appears fully sharp, while people positioned further back — along with the background tend to look blurred. Unlike some rivals, the S26 Ultra employs no hardware or software mechanism to compensate for this, leaving its depth-of-field performance slightly behind that of some competitors.
Samsung Galaxy S26 Ultra - Depth of field
Samsung Galaxy S26 Ultra - Shallow depth of field, second face slightly out of focus
Samsung Galaxy S25 Ultra - Depth of field
Samsung Galaxy S25 Ultra - Wide depth of field, both faces in focus
Google Pixel 10 Pro XL - Depth of field
Google Pixel 10 Pro XL - Wide depth of field, both faces in focus
Texture tests analyze the level of details and the texture of subjects in the images taken in the lab as well as in real-life scenarios. For natural shots, particular attention is paid to the level of details in the bright and dark areas of the image. Objective measurements are performed on chart images taken in various lighting conditions from 0.1 to 10,000+ lux and different kinds of dynamic range conditions. The charts used are the proprietary DXOMARK chart (DMC), and the Dead Leaves chart. We also have an AI based metric for the level of details on our realistic mannequins Eugene and Diana.
DXOMARK CHART (DMC) detail preservation score vs lux levels for handheld conditions
This graph shows the evolution of the DMC detail preservation score with the level of lux, for two holding conditions. DMC detail preservation score is derived from an AI-based metric trained to evaluate texture and details rendering on a selection of crops of our DXOMARK chart.
The Galaxy S26 Ultra delivers improved detail over its predecessor, maintaining higher levels of fine detail, with better rendering of facial features across various lighting conditions in real-life scenes. Texture performance also benefits from more effective handling of high-contrast scenes, where details are now better retained across both highlight and shadow areas.
Samsung Galaxy S26 Ultra - Texture
Samsung Galaxy S26 Ultra - Good detail, controlled noise
Samsung Galaxy S25 Ultra - Texture
Samsung Galaxy S25 Ultra - Good detail, noticeable noise
Apple iPhone 17 Pro - Texture
Apple iPhone 17 Pro - Good detail, controlled noise
However, detail rendering is not always consistent and very few times it even fails to match Samsung Galaxy S25 Ultra details rendering. If compared to Apple iPhone 17 Pro, the lower image resolution in bright light conditions leads to poorer fine details reproduction than the Apple flagship.
Noise tests analyze various attributes of noise such as intensity, chromaticity, grain, structure on real-life images as well as images of charts taken in the lab. For natural images, particular attention is paid to the noise on faces, landscapes, but also on dark areas and high dynamic range conditions. Noise on moving objects is also evaluated on natural images. Objective measurements are performed on images of charts taken in various conditions from 0.1 to 10000 lux and different kinds of dynamic range conditions. The chart used is the Dead Leaves chart and the standardized measurement such as Visual Noise derived from ISO 15739.
Visual noise evolution with illuminance levels in handheld condition
This graph shows the evolution of visual noise metric with the level of lux in handheld condition. The visual noise metric is the mean of visual noise measurement on all patches of the Dead Leaves chart in the AFHDR setup. DXOMARK visual noise measurement is derived from ISO15739 standard.
Noise management has also been clearly improved on the Galaxy S26 Ultra. While the S25 Ultra suffered from pronounced noise — particularly in backlit scenes Samsung has reworked its processing pipeline, resulting in a noise profile that is now much more acceptable for a flagship device. Progress is evident across most lighting conditions, with a notable reduction in noise levels and a noise score that approaches that of the Apple iPhone. In extreme lowlight conditions (below 10 lux), The Samsung Galaxy S26 Ultra goes for a different strategy to predecessor, by allowing more noise for more natural details rendition on the scene.
Samsung Galaxy S26 Ultra
Weaker denoising for better details rendition
Samsung Galaxy S25 Ultra
Stronger denoising, fine details are locally lost
That said, a significant gap to the best-in-class devices remains, in both lab measurements and perceptual evaluation. In many real-life scenes, especially portraits, background noise remains distracting across various lighting conditions, and lab metrics continue to show higher noise levels than those of most top-end competitors.
When considering texture and noise together, the Galaxy S26 Ultra shows a clear improvement over the previous generation. Despite this progress, however, the combined performance still trails that of the leading competitors, who offer cleaner backgrounds and more consistent fine detail across all conditions.
The artifacts evaluation looks at flare, lens shading, chromatic aberrations, geometrical distortion, edges ringing, halos, ghosting, quantization, unexpected color hue shifts, among others type of possible unnatural effects on photos. The more severe and the more frequent the artifact, the higher the point deduction on the score. The main artifacts observed and corresponding point loss are listed below.
Overall, Samsung Galaxy S26 Ultra is improved compared to previous version, but some artifacts like halo and fusion artifacts remains sometimes visible, which has become very rare on competition.
Bokeh is tested in one dedicated mode, usually portrait or aperture mode, and analyzed by visually inspecting all the images captured in the lab and in natural conditions. The goal is to reproduce portrait photography comparable to one taken with a DLSR and a wide aperture. The main image quality attributes paid attention to are depth estimation, artifacts, blur gradient, and the shape of the bokeh blur spotlights. Portrait image quality attributes (exposure, color, texture) are also taken into account.
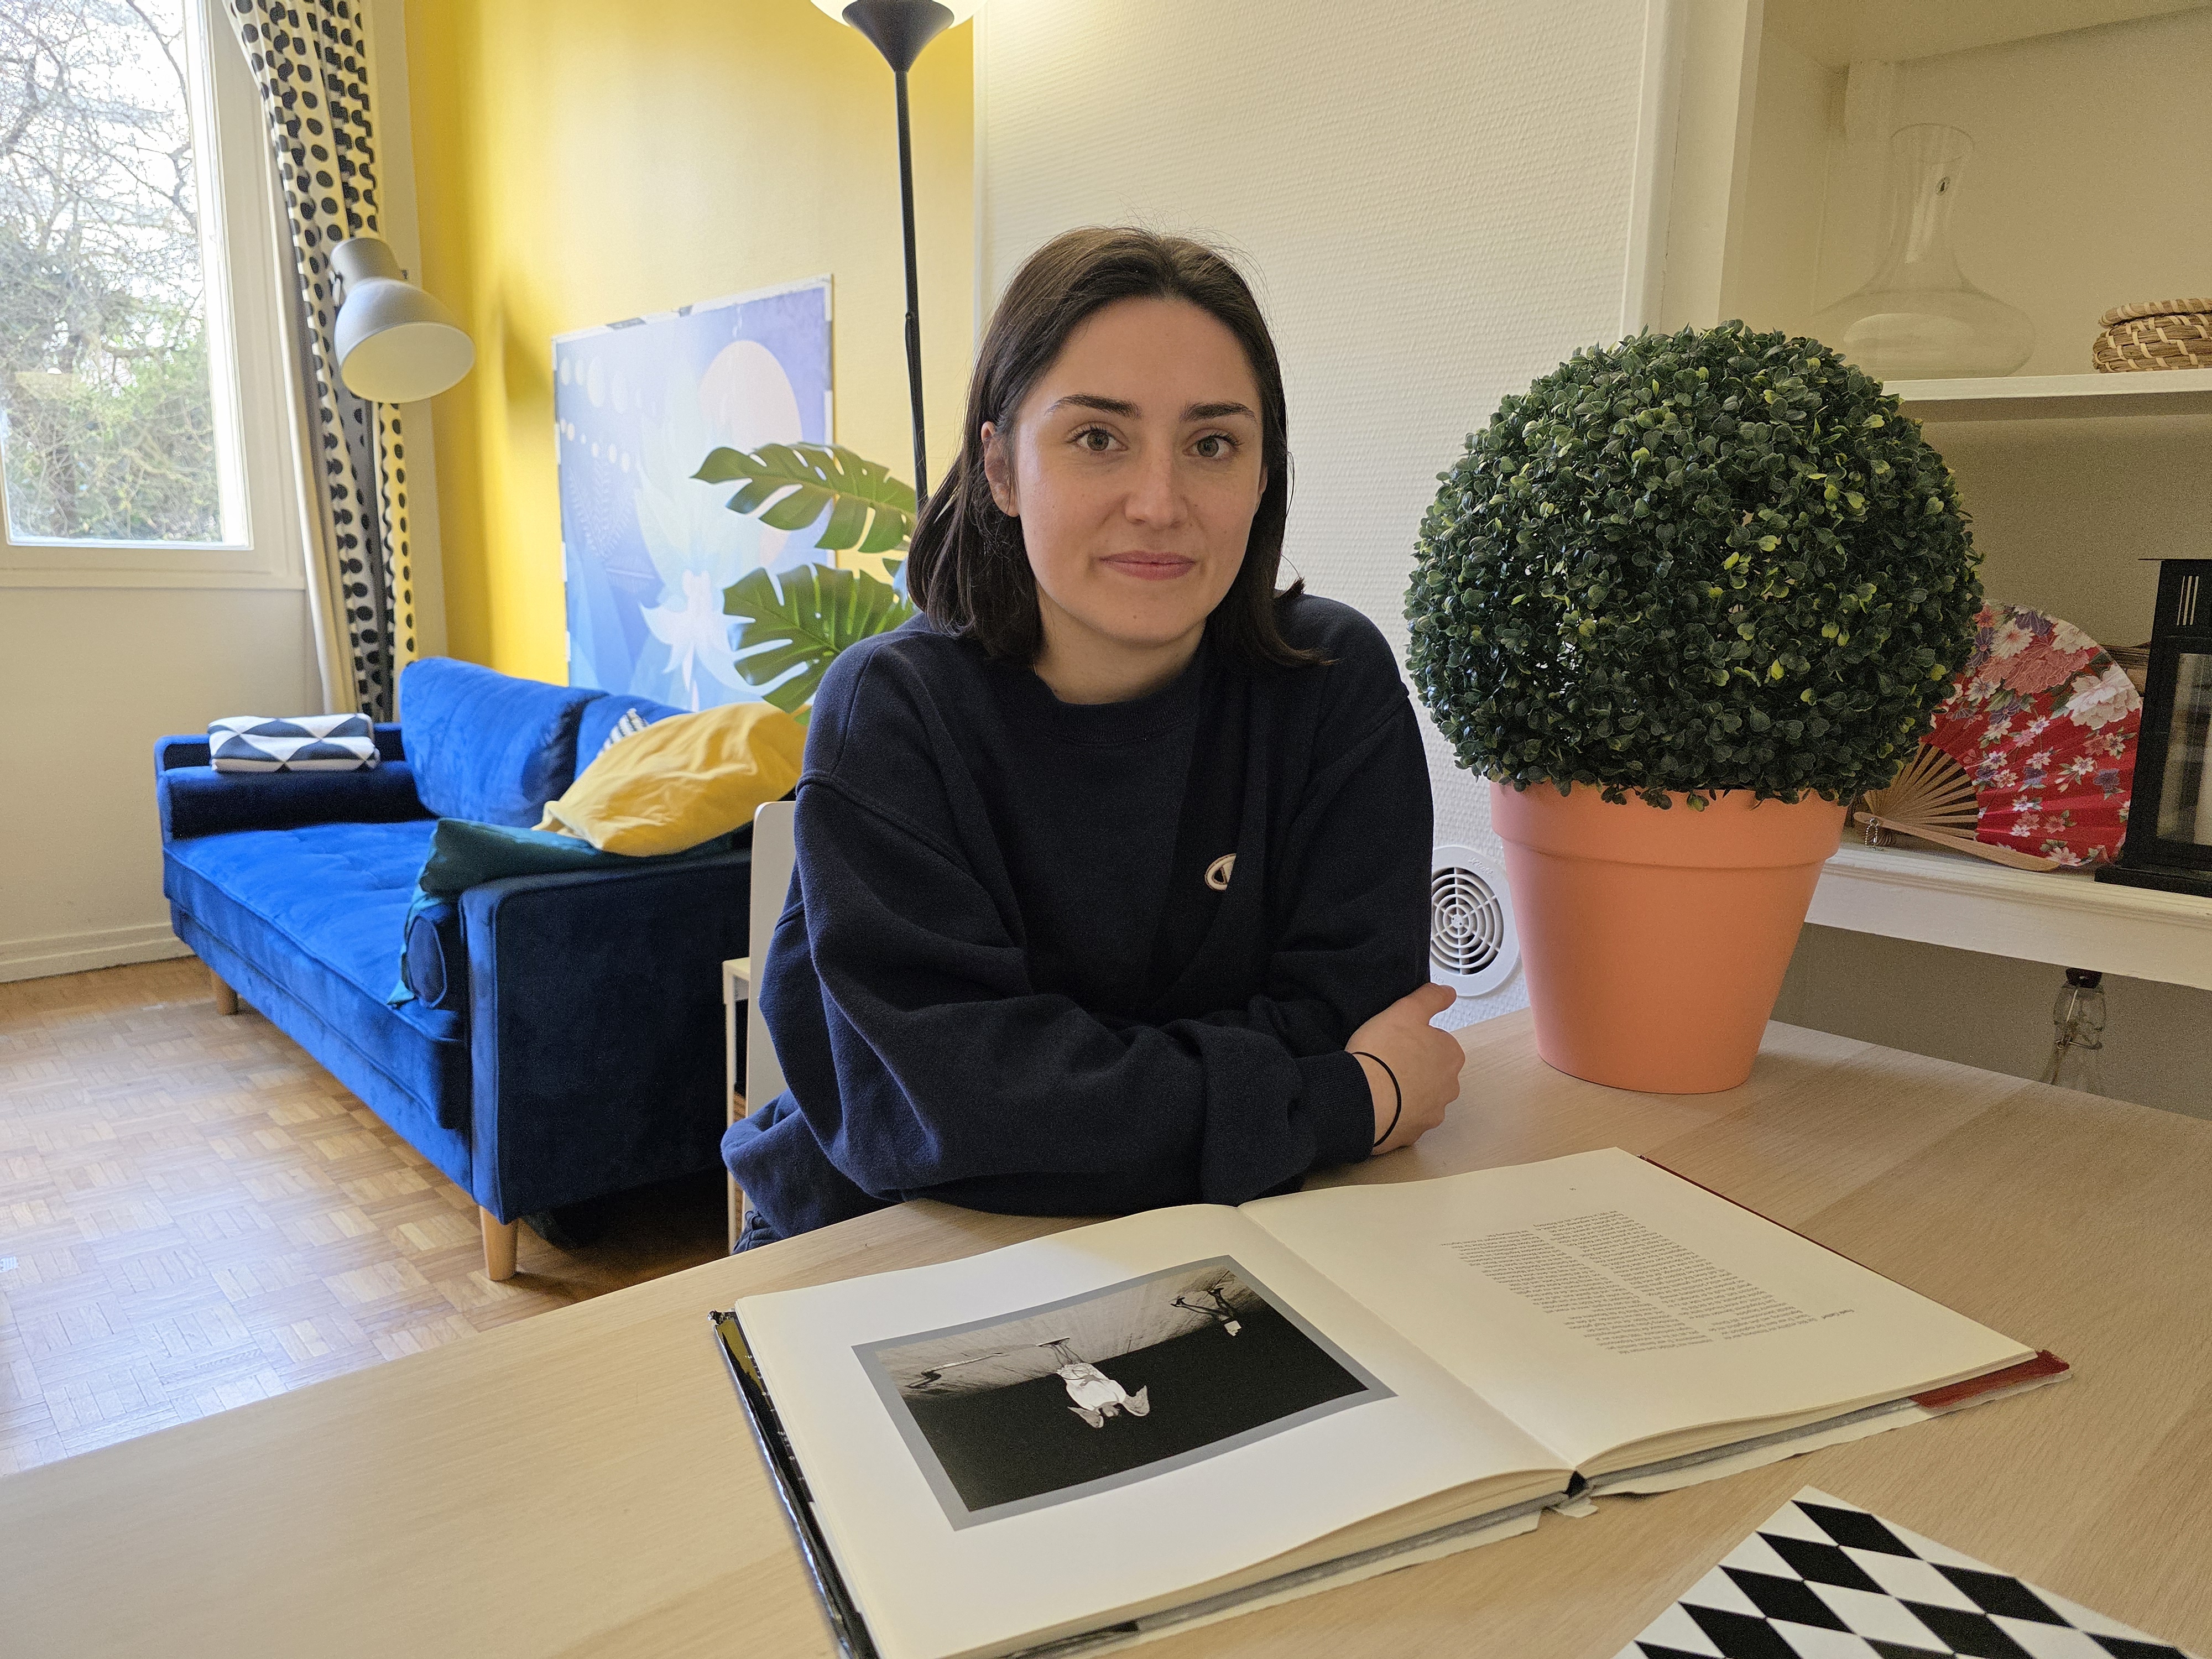
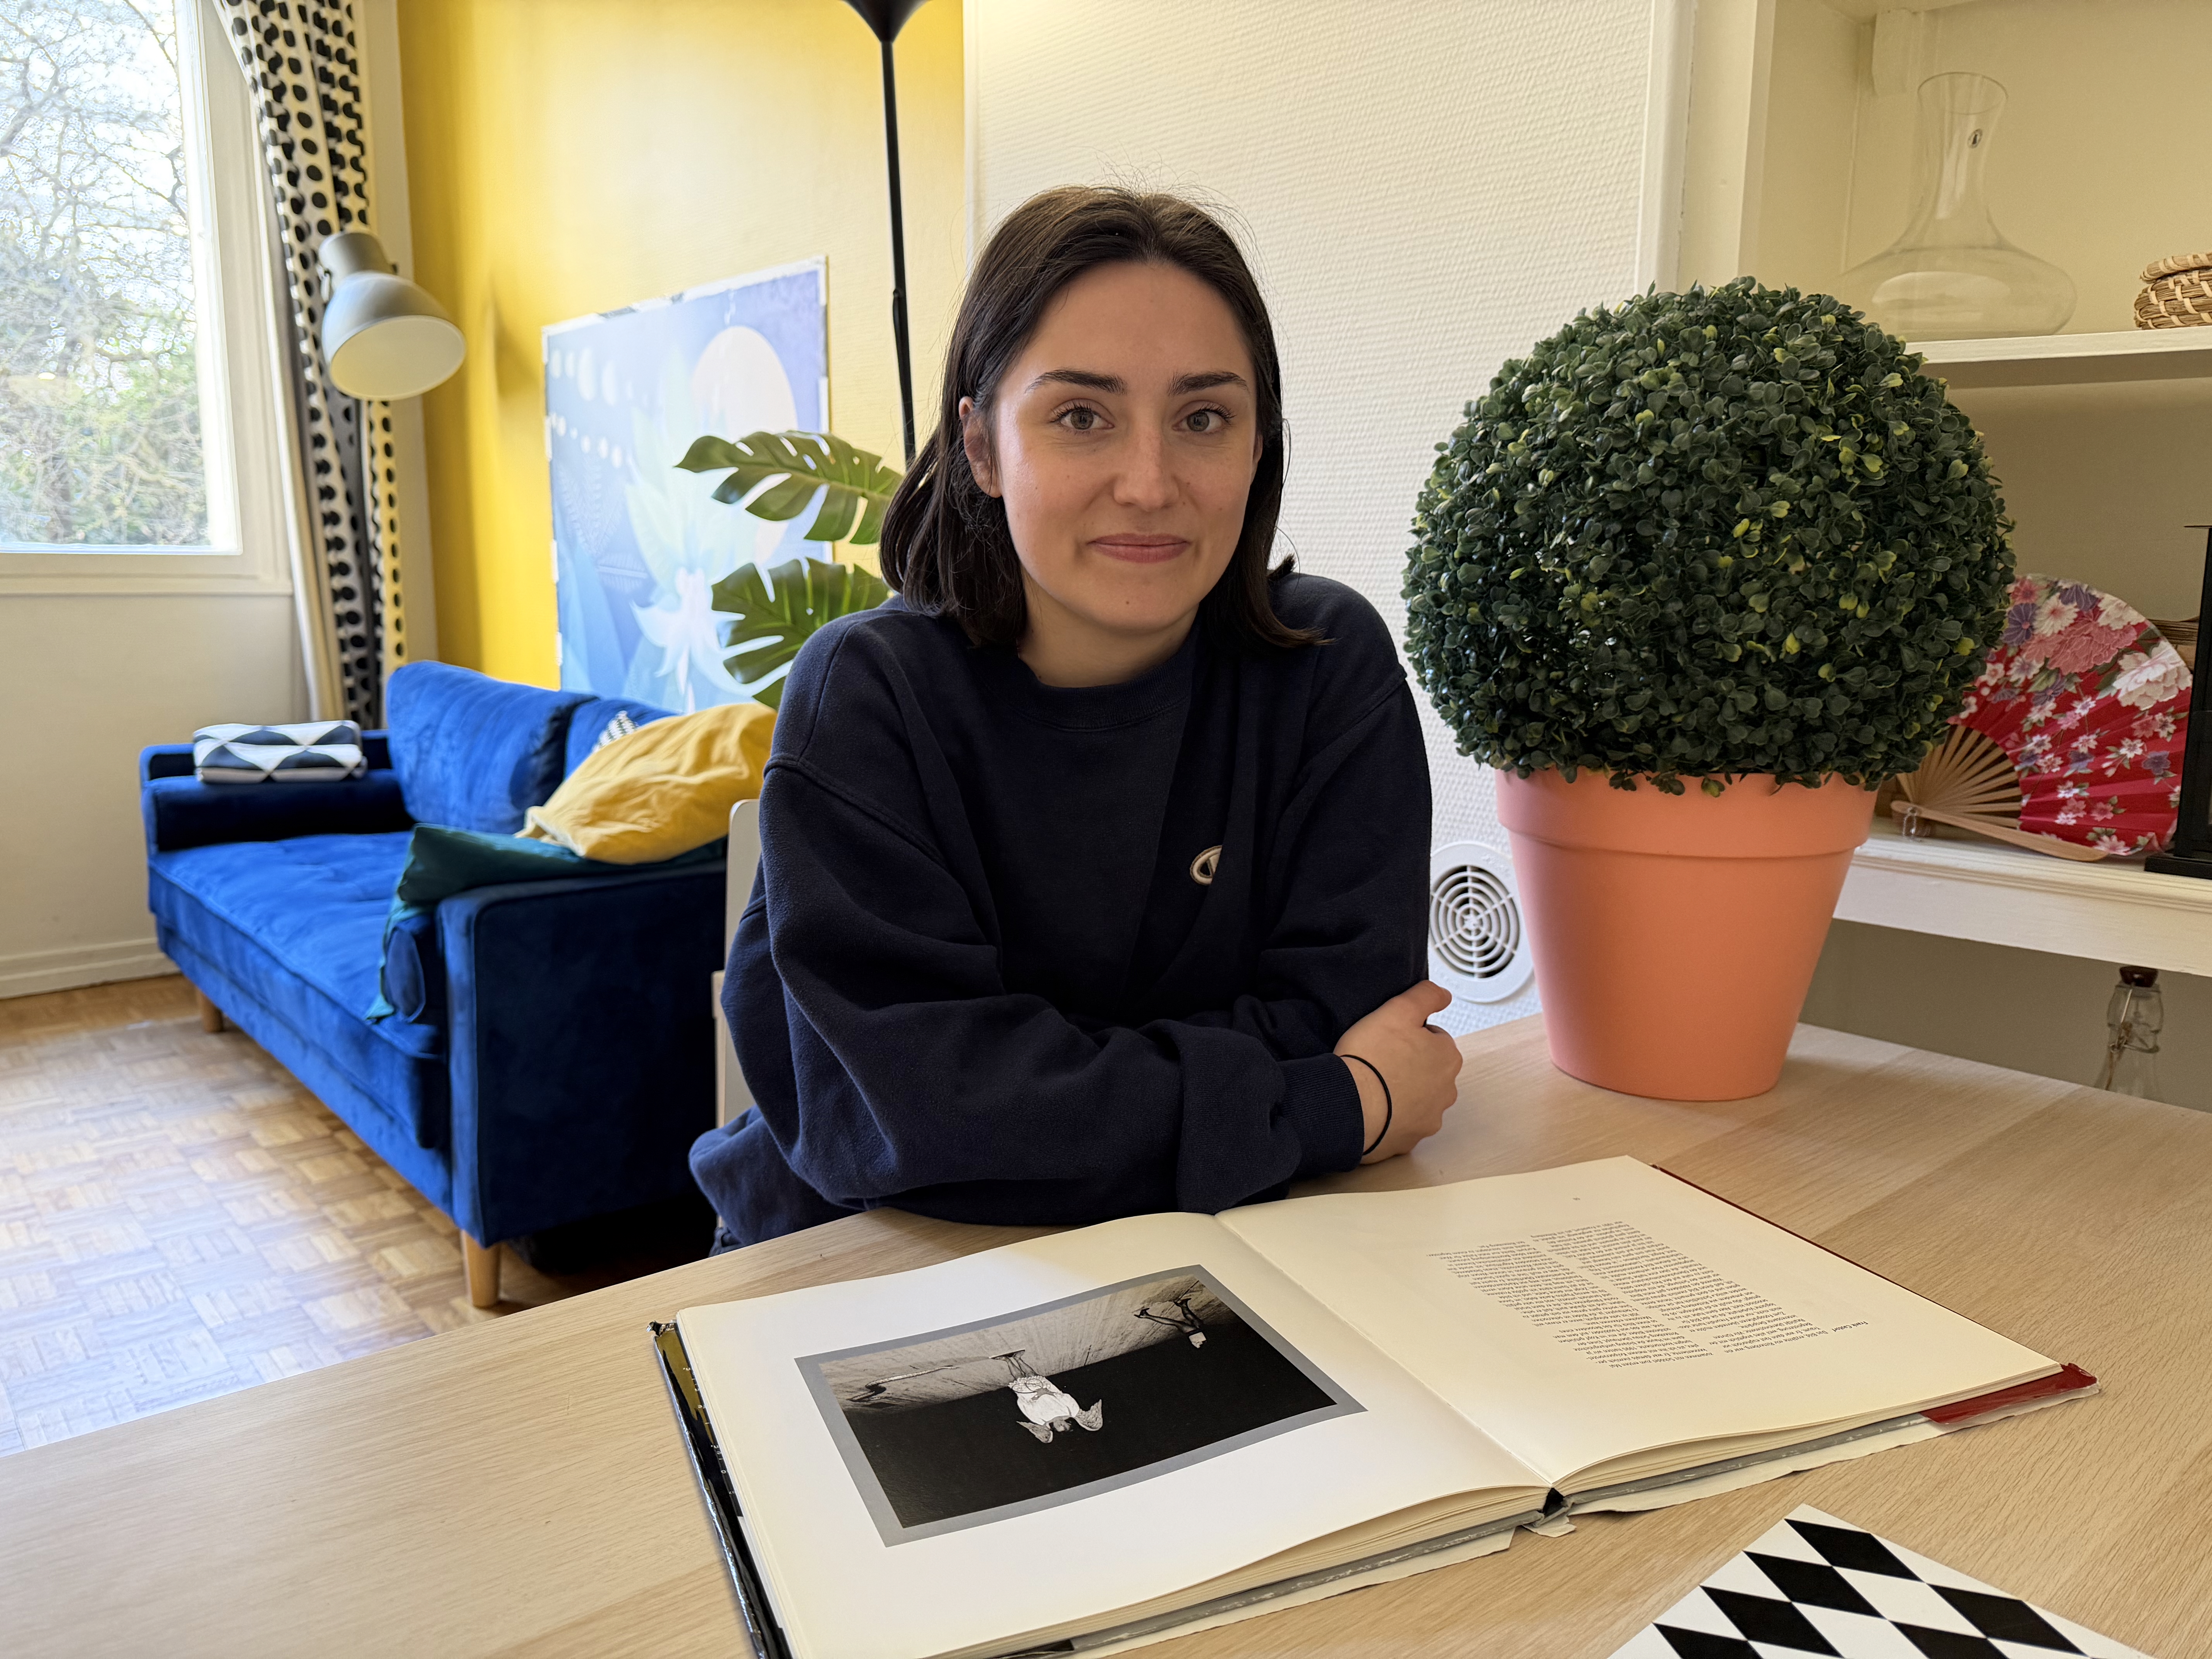
The Galaxy S26 Ultra offers a capable portrait mode with generally accurate subject segmentation that handles most outlines well, though small details such as fine hair or intricate edges still show occasional imprecision. The background blur is convincing and stable, though users may notice subtle shifts in color or exposure compared to the standard photo mode. While the overall rendering is pleasing, texture preservation does not match the very best smartphone cameras in this category, leaving some fine details slightly softened.
Samsung Galaxy S26 Ultra - Bokeh mode
Samsung Galaxy S26 Ultra - Inaccurate segmentation of fine detail (hair), loss of face detail
Google Pixel 10 Pro XL - Bokeh mode
Google Pixel 10 Pro XL - Slightly inaccurate segmentation of fine detail (hair), loss of fine face detail, low noise
Apple iPhone 17 Pro - Bokeh mode
Apple iPhone 17 Pro - Accurate segmentation of fine detail (hair), loss of fine face detail, low noise
All image quality attributes are evaluated at focal lengths from approximately 40 mm to 300 mm, with particular attention paid to texture and detail. The score is derived from a number of objective measurements in the lab and perceptual analysis of real-life images.
Samsung Galaxy S26 Ultra Telephoto Scores
This graph illustrates the relative scores for the different zoom ranges evaluated. The abscissa is expressed in 35mm equivalent focal length.
The S26 Ultra’s telephoto score remains close to that of last year’s model, with only minor progression. While texture measurements show some decrease (graph below with lower DMC score on most zoom ratio tested), improved noise levels result in cleaner images overall. Although perceived sharpness is slightly lower, the overall rendering appears more natural. Color reproduction also shows progress, with more accurate tones and better white balance in real-life scenes. Additionally, several of the occasional telephoto failures observed during S25 Ultra testing are no longer present on the S26 Ultra, contributing to a more reliable experience overall.
DXOMARK CHART (DMC) detail preservation score per focal length
This graph shows the evolution of the DMC detail preservation score with respect to the full-frame equivalent focal length for different light conditions. The x-axis represents the equivalent focal length measured for each corresponding shooting distance and the y-axis represents the maximum details preservation metric score: higher value means better quality. Large dots correspond to zoom ratio available in the user interface of the camera application.
Samsung S26 Ultra - Tele
Samsung S26 Ultra - Natural texture/noise rendering, pleasant colors
These tests analyze the performance of the ultra-wide camera at several focal lengths from 12 mm to 20 mm. All image quality attributes are evaluated, with particular attention paid to such artifacts as chromatic aberrations, lens softness, and distortion. Pictures below are an extract of tested scenes.
Samsung Galaxy S26 Ultra Ultra-Wide Scores
This graph illustrates the relative scores for the different zoom ranges evaluated. The abscissa is expressed in 35mm equivalent focal length.
Measurements from the S26 Ultra’s ultra-wide camera show improved noise levels compared to the previous generation, consistent with the progress observed on the primary and telephoto modules. In outdoor conditions, the ultra-wide delivers good overall quality, with clean images and stable rendering. In low light, however, autofocus failures significantly impact the texture score, leading to reduced sharpness and dragging down the overall wide-angle score compared to predecessor and other flagships.
DXOMARK CHART (DMC) detail preservation score per focal length
This graph shows the evolution of the DMC detail preservation score with respect to the full-frame equivalent focal length for different light conditions. The x-axis represents the equivalent focal length measured for each corresponding shooting distance and the y-axis represents the maximum details preservation metric score: higher value means better quality. Large dots correspond to zoom ratio available in the user interface of the camera application.
Samsung Galaxy S26 Ultra – Nice colors, brightest rendering, fine details on fabric are lost
Google Pixel 10 Pro XL – Nice colors, slight lack of brightness on face
Apple iPhone 17 Pro – Nice colors, fine details very well recovered
DXOMARK engineers capture and evaluate almost 3 hours of video in controlled lab environments and in natural low-light, indoor and outdoor scenes, using the camera’s default settings. The evaluation consists of visually inspecting natural videos taken in various conditions and running objective measurements on videos of charts recorded in the lab under different conditions from 0.1 to 10000+ lux and color temperatures from 2,300K to 6,500K.
The Samsung Galaxy S26 Ultra’s video mode benefits from improved multi-frame processing, enhanced HDR video algorithms, and refined optical image stabilization hardware. The device supports up to 8K recording and offers 4K capture across multiple focal lengths, leveraging its advanced sensor-shift OIS and gyro-EIS fusion stabilization system. Testing was conducted at 4K resolution, 60fps, and with HDR10 activated, which yielded the best overall results.
Overall, the S26 Ultra represents a meaningful improvement over the S25 Ultra in video, offering reliable exposure, attractive color, solid noise control, and effective stabilization. While it does not quite redefine video quality in the ultra-premium segment, it remains a versatile performer that will satisfy most users — even if the very best video-focused devices still maintain a measurable edge, particularly in low-light conditions.
Main
160
Samsung Galaxy S26 Ultra
186
Apple iPhone 17 Pro
Apple iPhone 17 Pro
Samsung Galaxy S26 Ultra Video scores
Video Main tests analyze the same image quality attributes as for still images, such as exposure, color, texture, or noise, in addition to temporal aspects such as speed, and smoothness and stability of exposure, white balance, and autofocus transitions.
Exposure tests evaluate the brightness level of the main subject, the global contrast and the ability to render the dynamic range of the scene (ability to render visible details in both bright and dark areas). When the camera provides Video HDR format, the videos are analyzed with a visualization on an HDR reference monitor, under reference conditions specified in the metadata. Stability and temporal adaption of the exposure are also analyzed.
Brightness on face with illuminance levels (Diana)
These graphs represent the output level on the face measured on the images captured by the device under test in multiple lighting conditions on the AFHDR Portrait setup. We show here the intensity measured on the forehead of the realistic mannequin, for a picture displayed on a HDR monitor in standard ISO/TS 22028-5 playback conditions. The multiple lighting conditions of the scene are characterized by the illumination level in lux and the relative brightness of the backlit panel simulating high dynamic range conditions. Delta EV specifies the difference of luminance in stops between the face and the light panel simulating HDR conditions. The intensity is measured in JND derived from the ICtCp color space.
Brightness on face with illuminance levels (Eugene)
These graphs represent the output level on the face measured on the images captured by the device under test in multiple lighting conditions on the AFHDR Portrait setup. We show here the intensity measured on the forehead of the realistic mannequin, for a picture displayed on a HDR monitor in standard ISO/TS 22028-5 playback conditions. The multiple lighting conditions of the scene are characterized by the illumination level in lux and the relative brightness of the backlit panel simulating high dynamic range conditions. Delta EV specifies the difference of luminance in stops between the face and the light panel simulating HDR conditions. The intensity is measured in JND derived from the ICtCp color space.
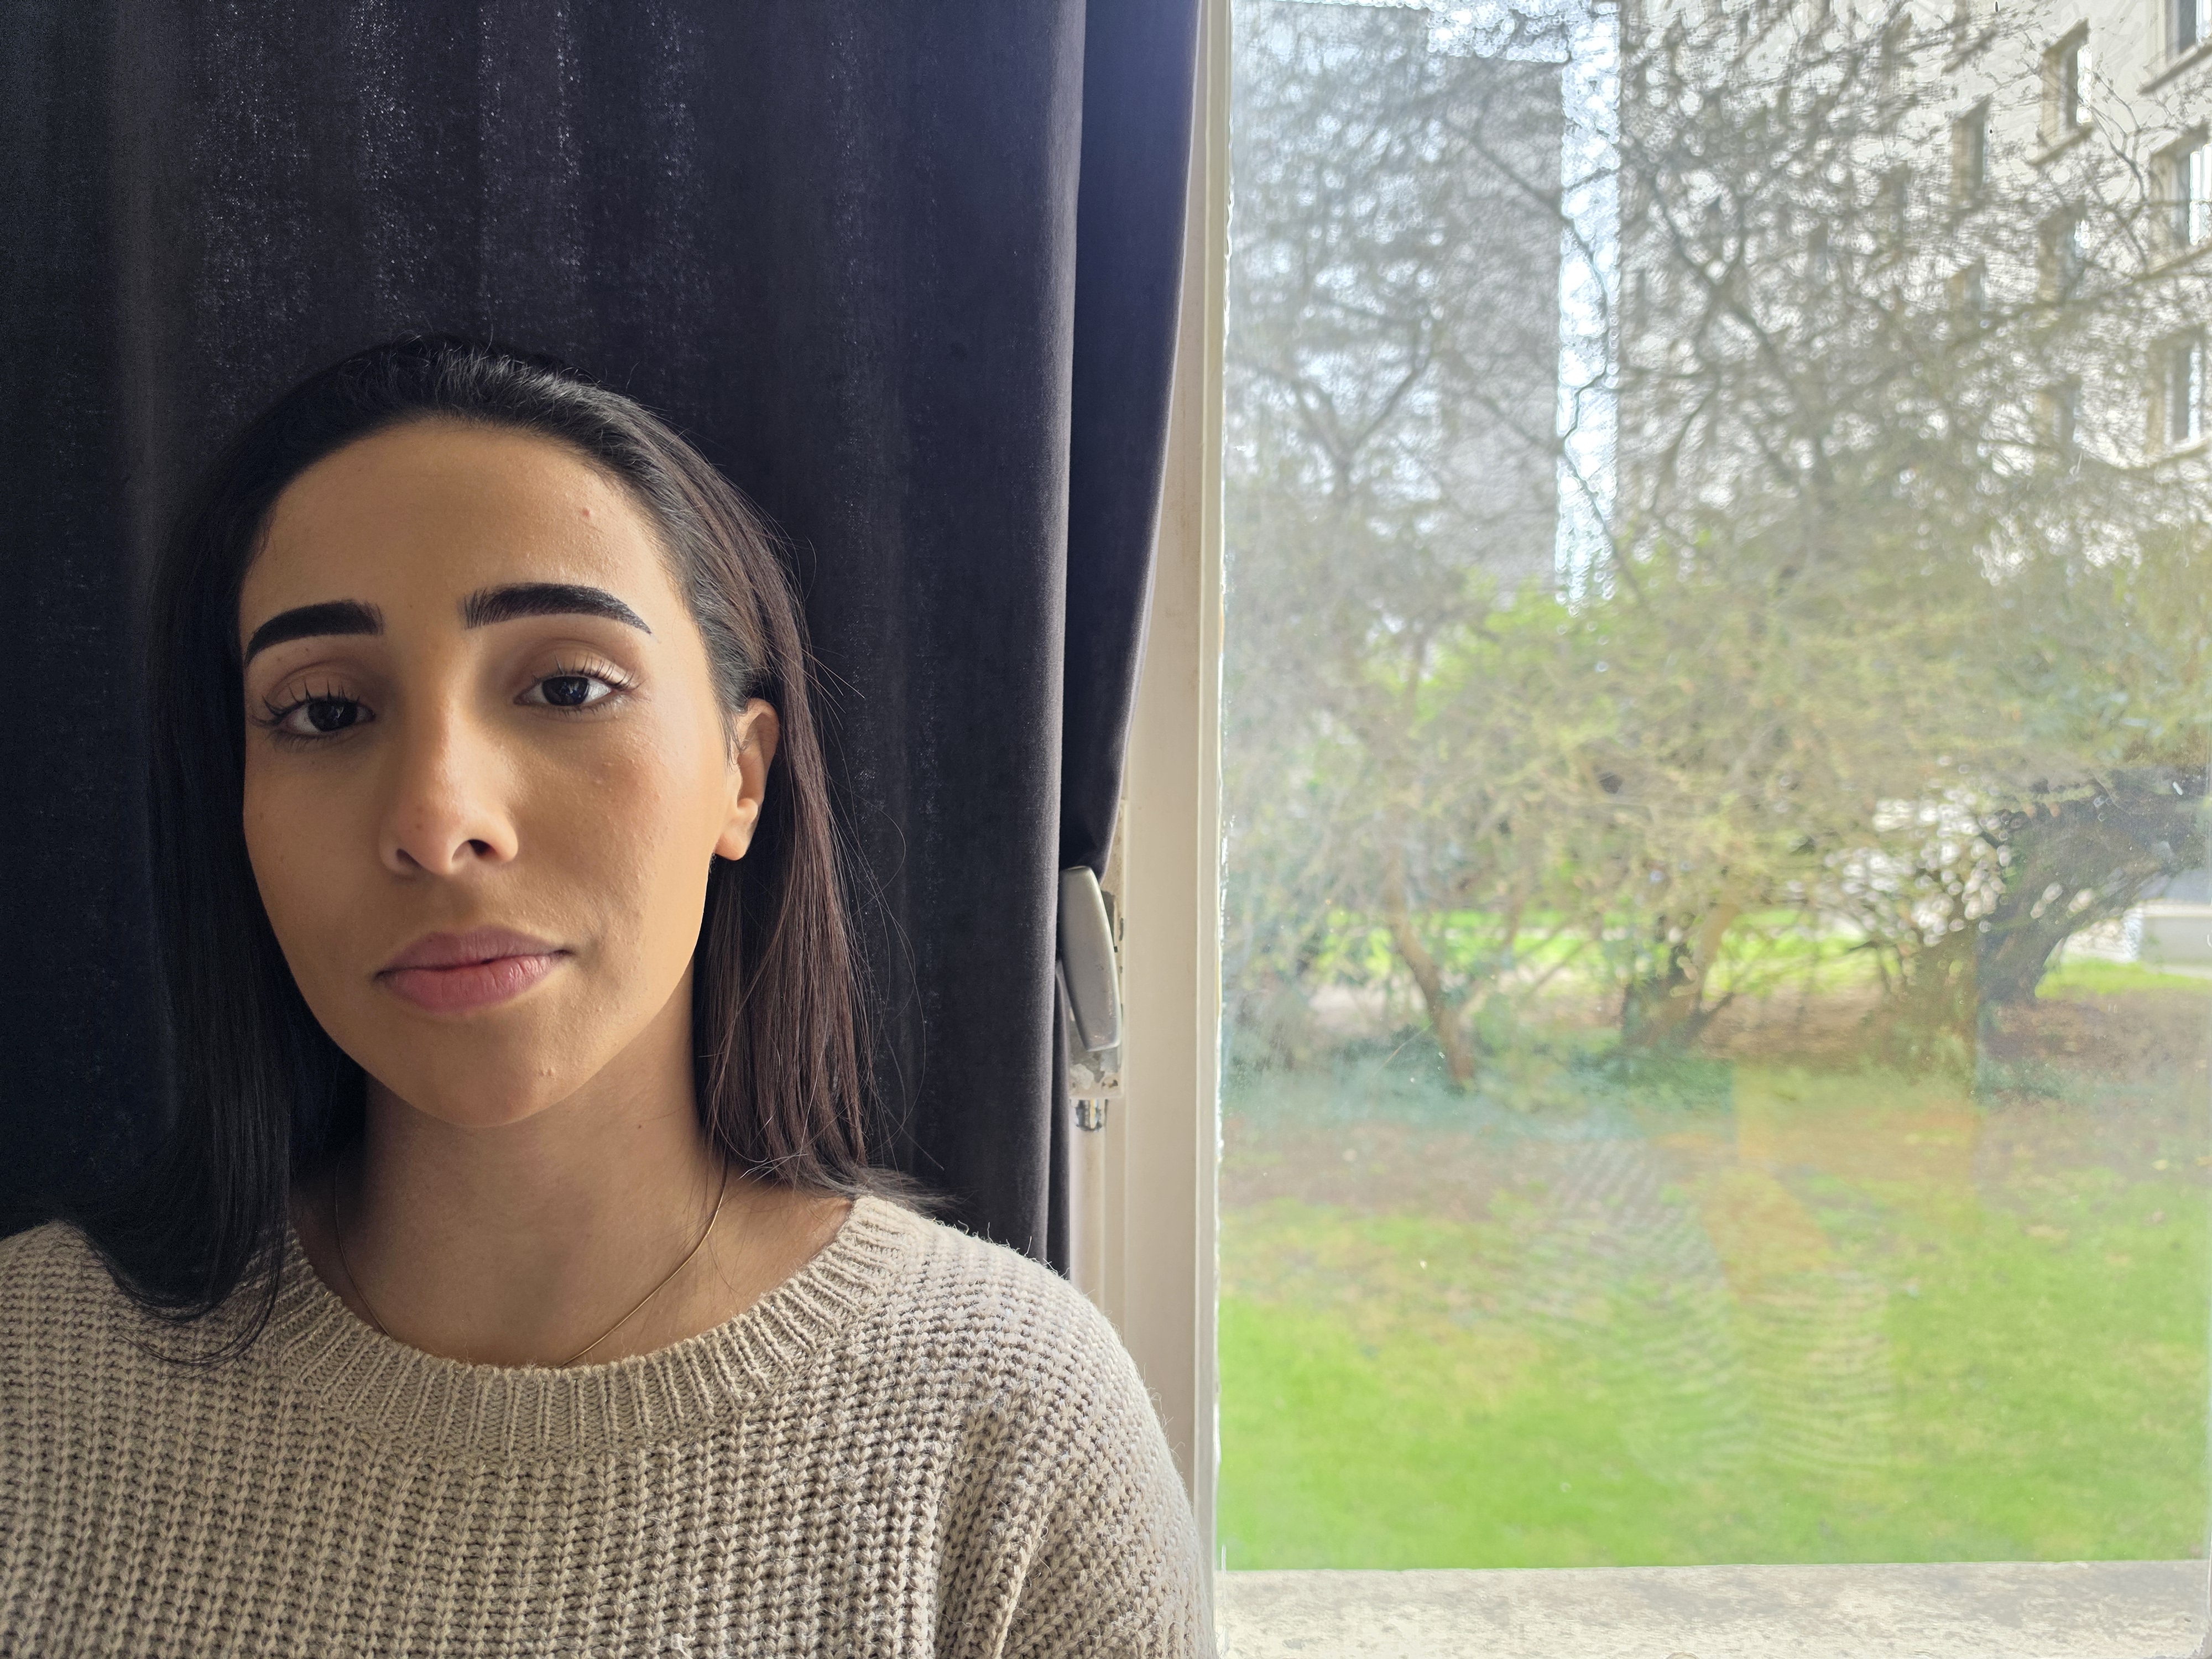
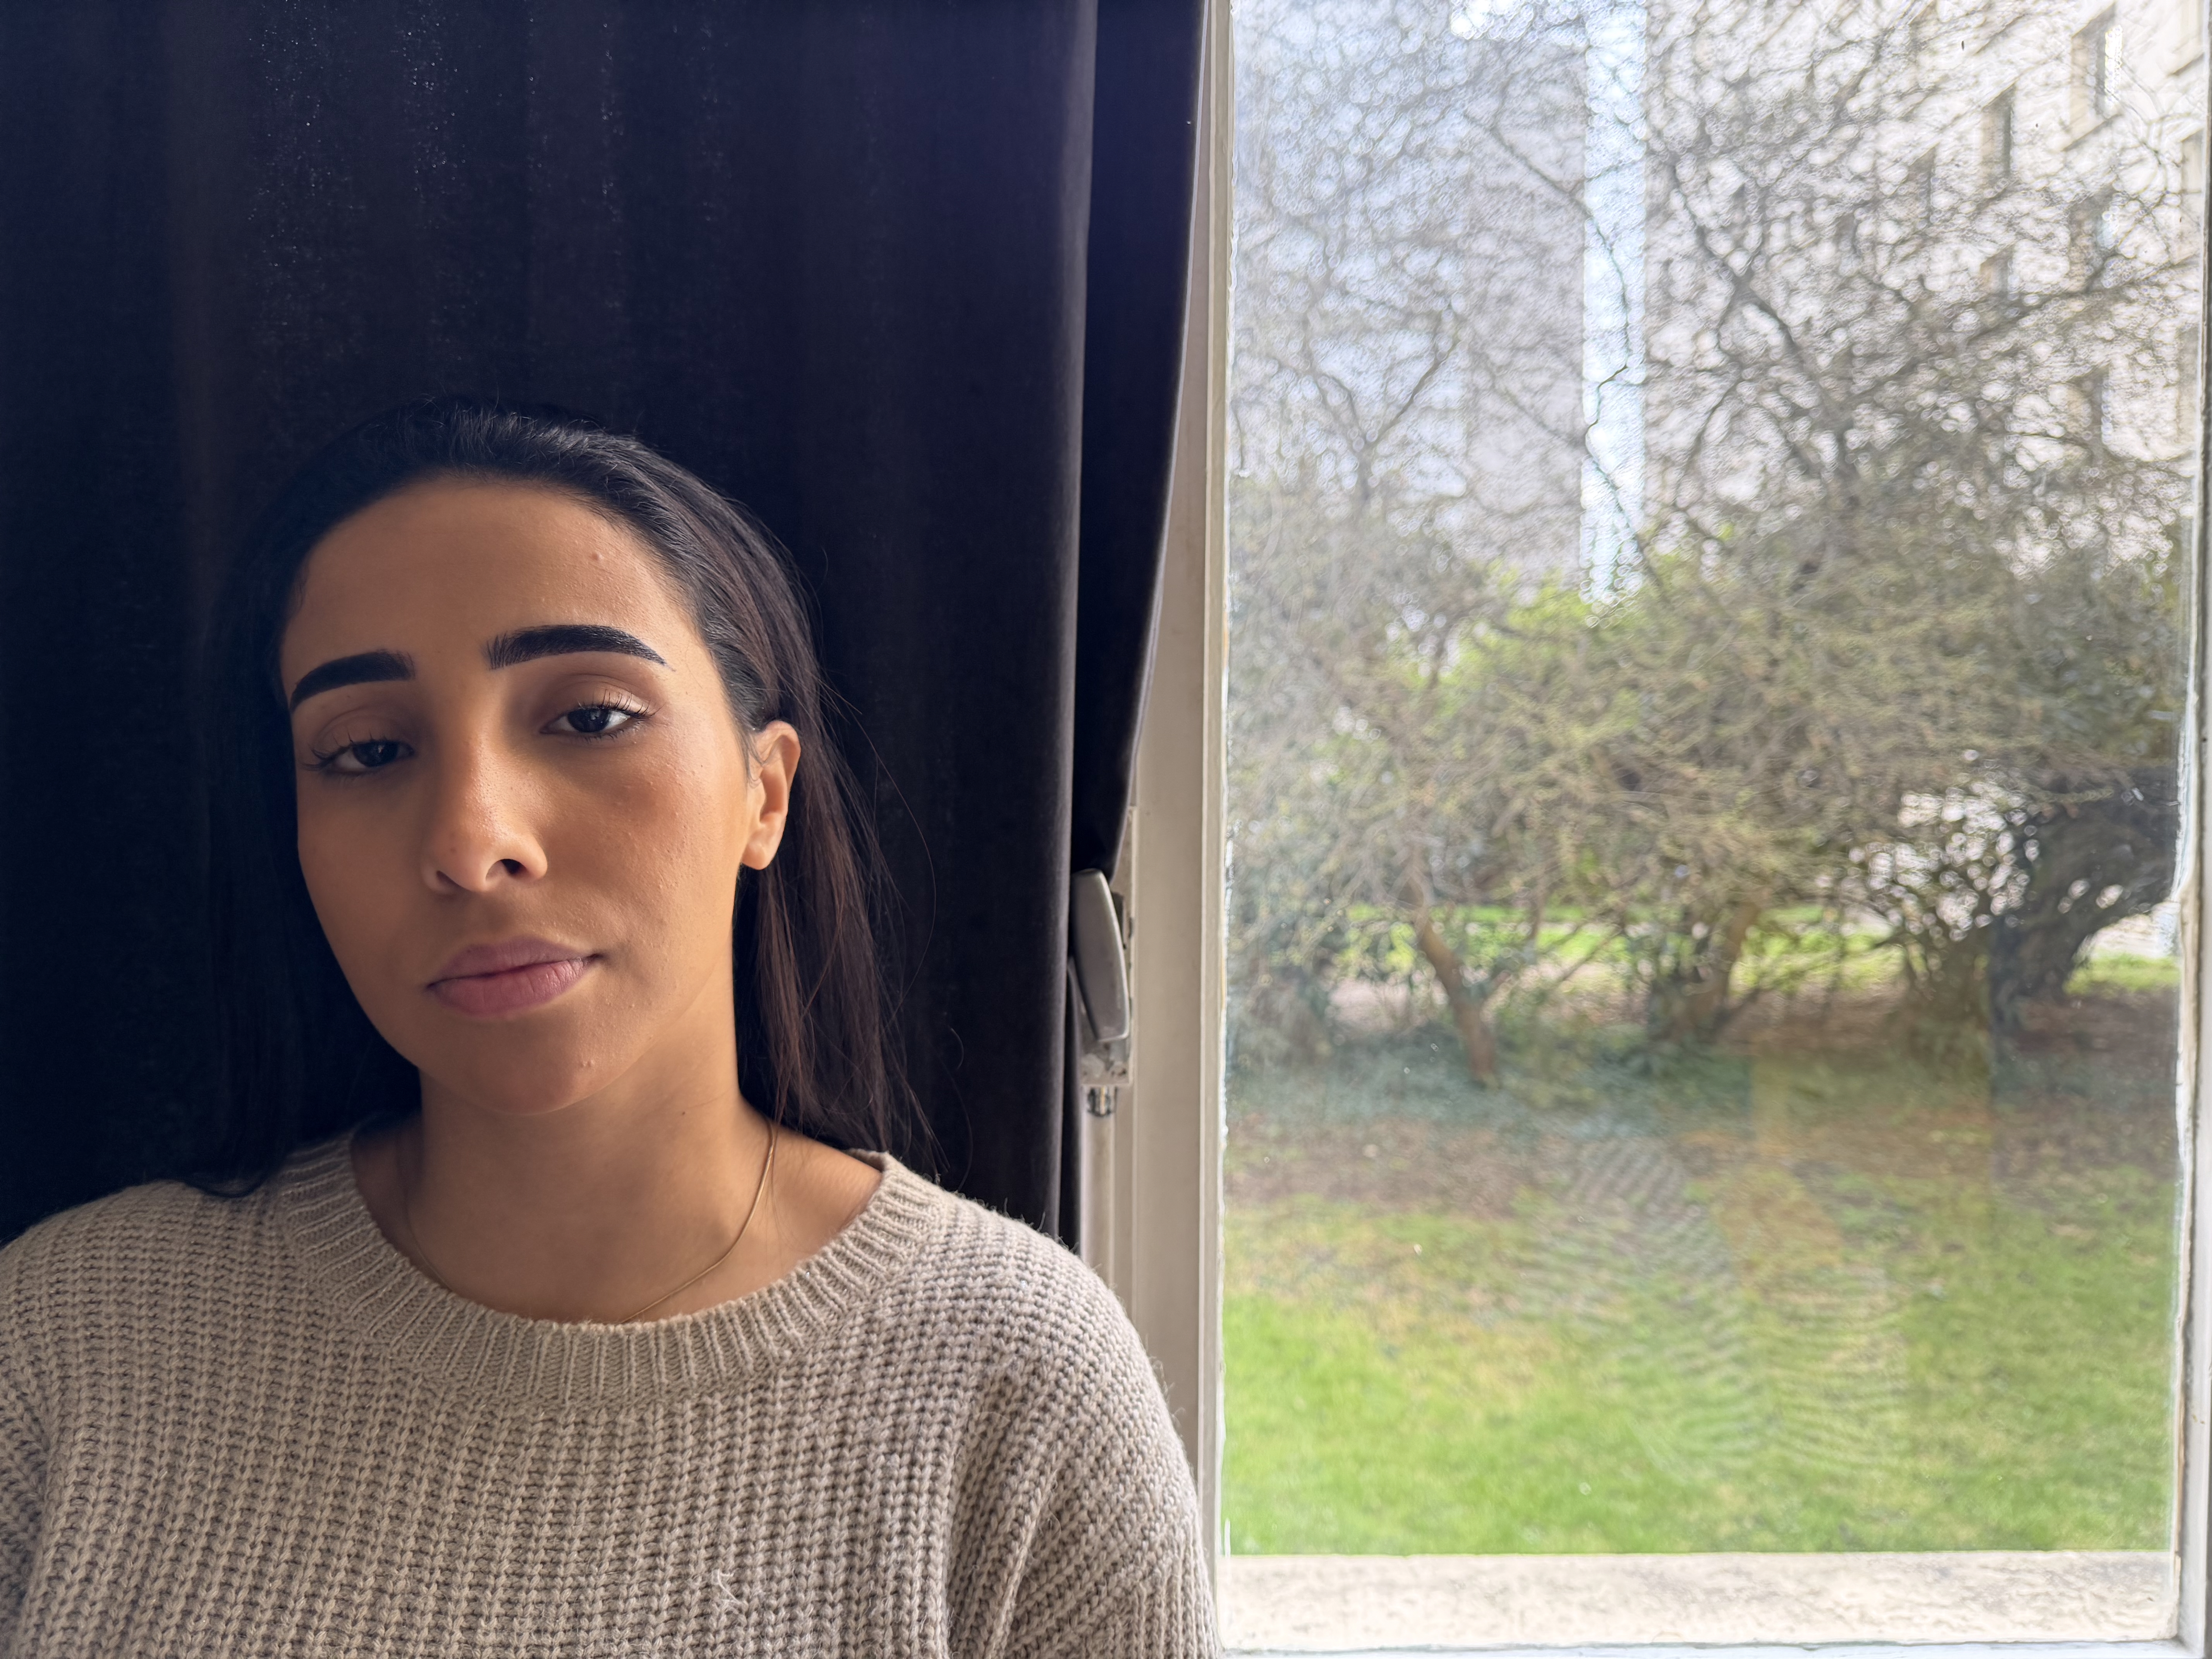
Video exposure is generally good across all conditions and scene types. The S26 Ultra maintains stable target exposure and wide dynamic range, particularly in bright scenes where highlight clipping is well contained — broadly on par with the S25 Ultra and iPhone 17 Pro. Occasionally, target exposure can run slightly low, for example in backlit portrait situations.
Auto-exposure works effectively, with correct adaptation to changes in illumination. In one test scene featuring a subject appearing in front of a window, adaptation was slow, though the eventual target exposure was correct.
Samsung Galaxy S26 Ultra – Accurate and stable target expsoure
Samsung Galaxy S25 Ultra – Accurate and stable target expsoure
Apple iPhone 17 Pro – Accurate and stable target expsoure
Image-quality color analysis looks at color rendering, skin-tone rendering, white balance, color shading, stability of the white balance and its adaption when light is changing.
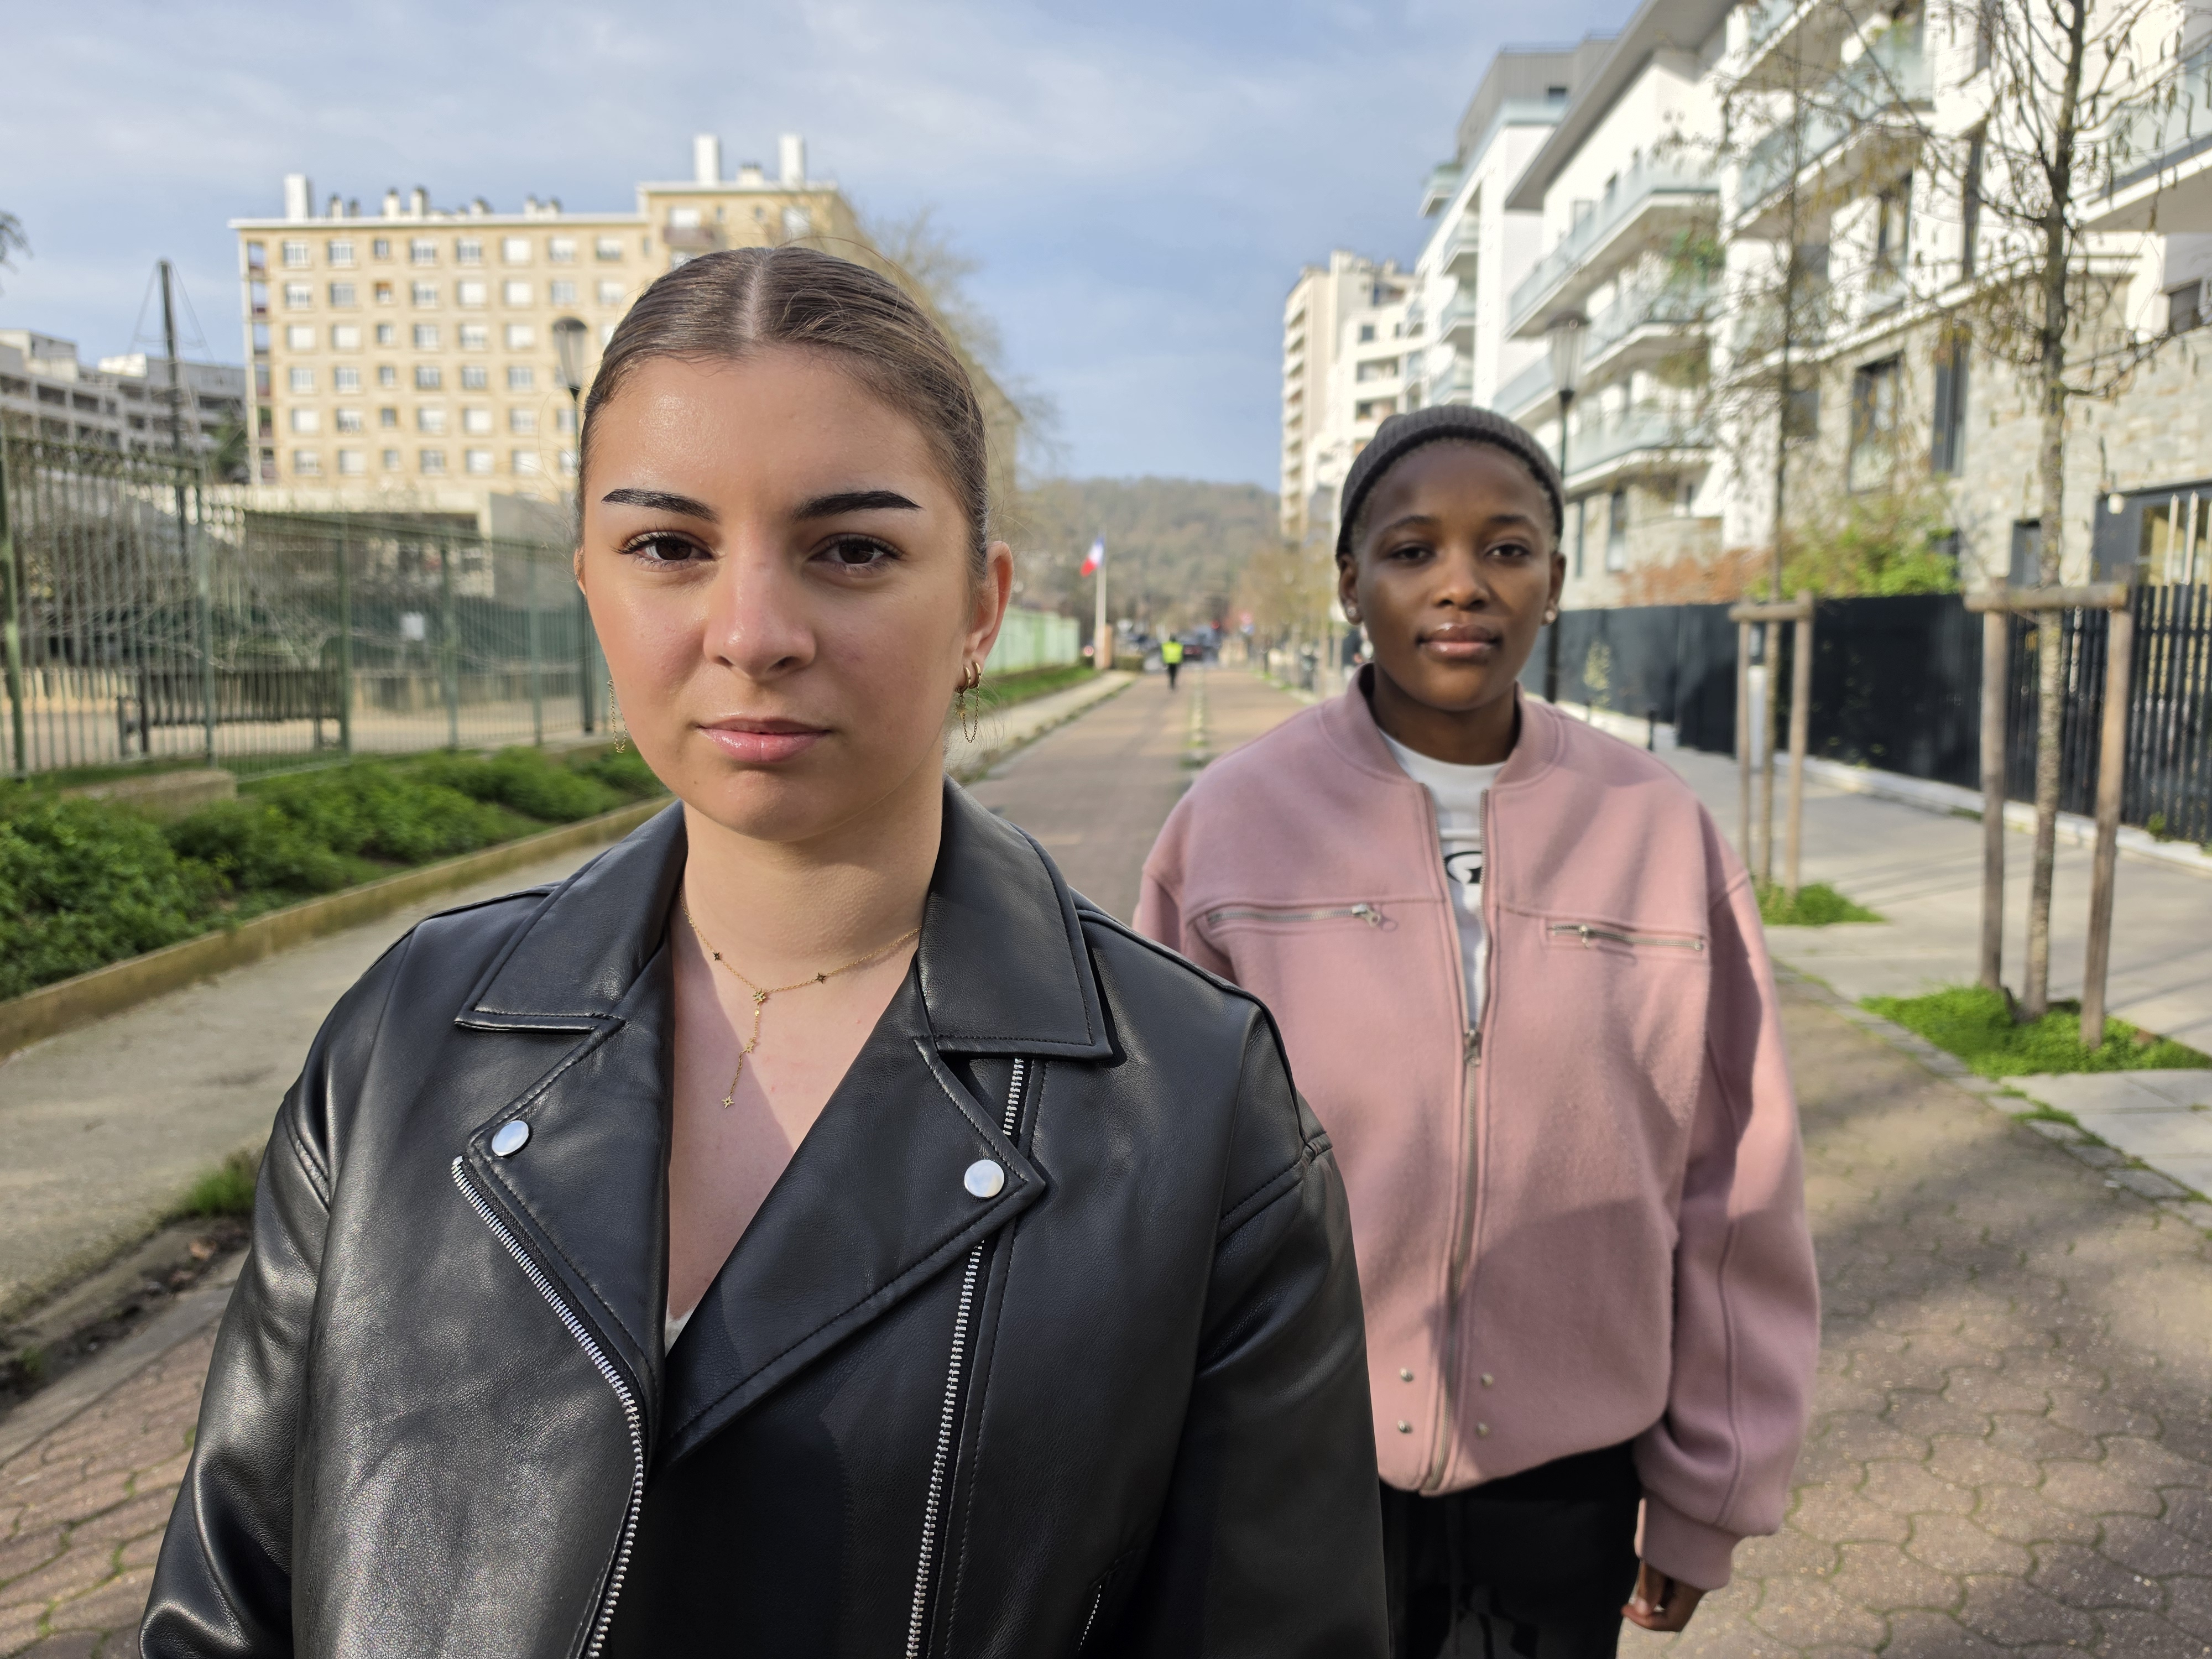
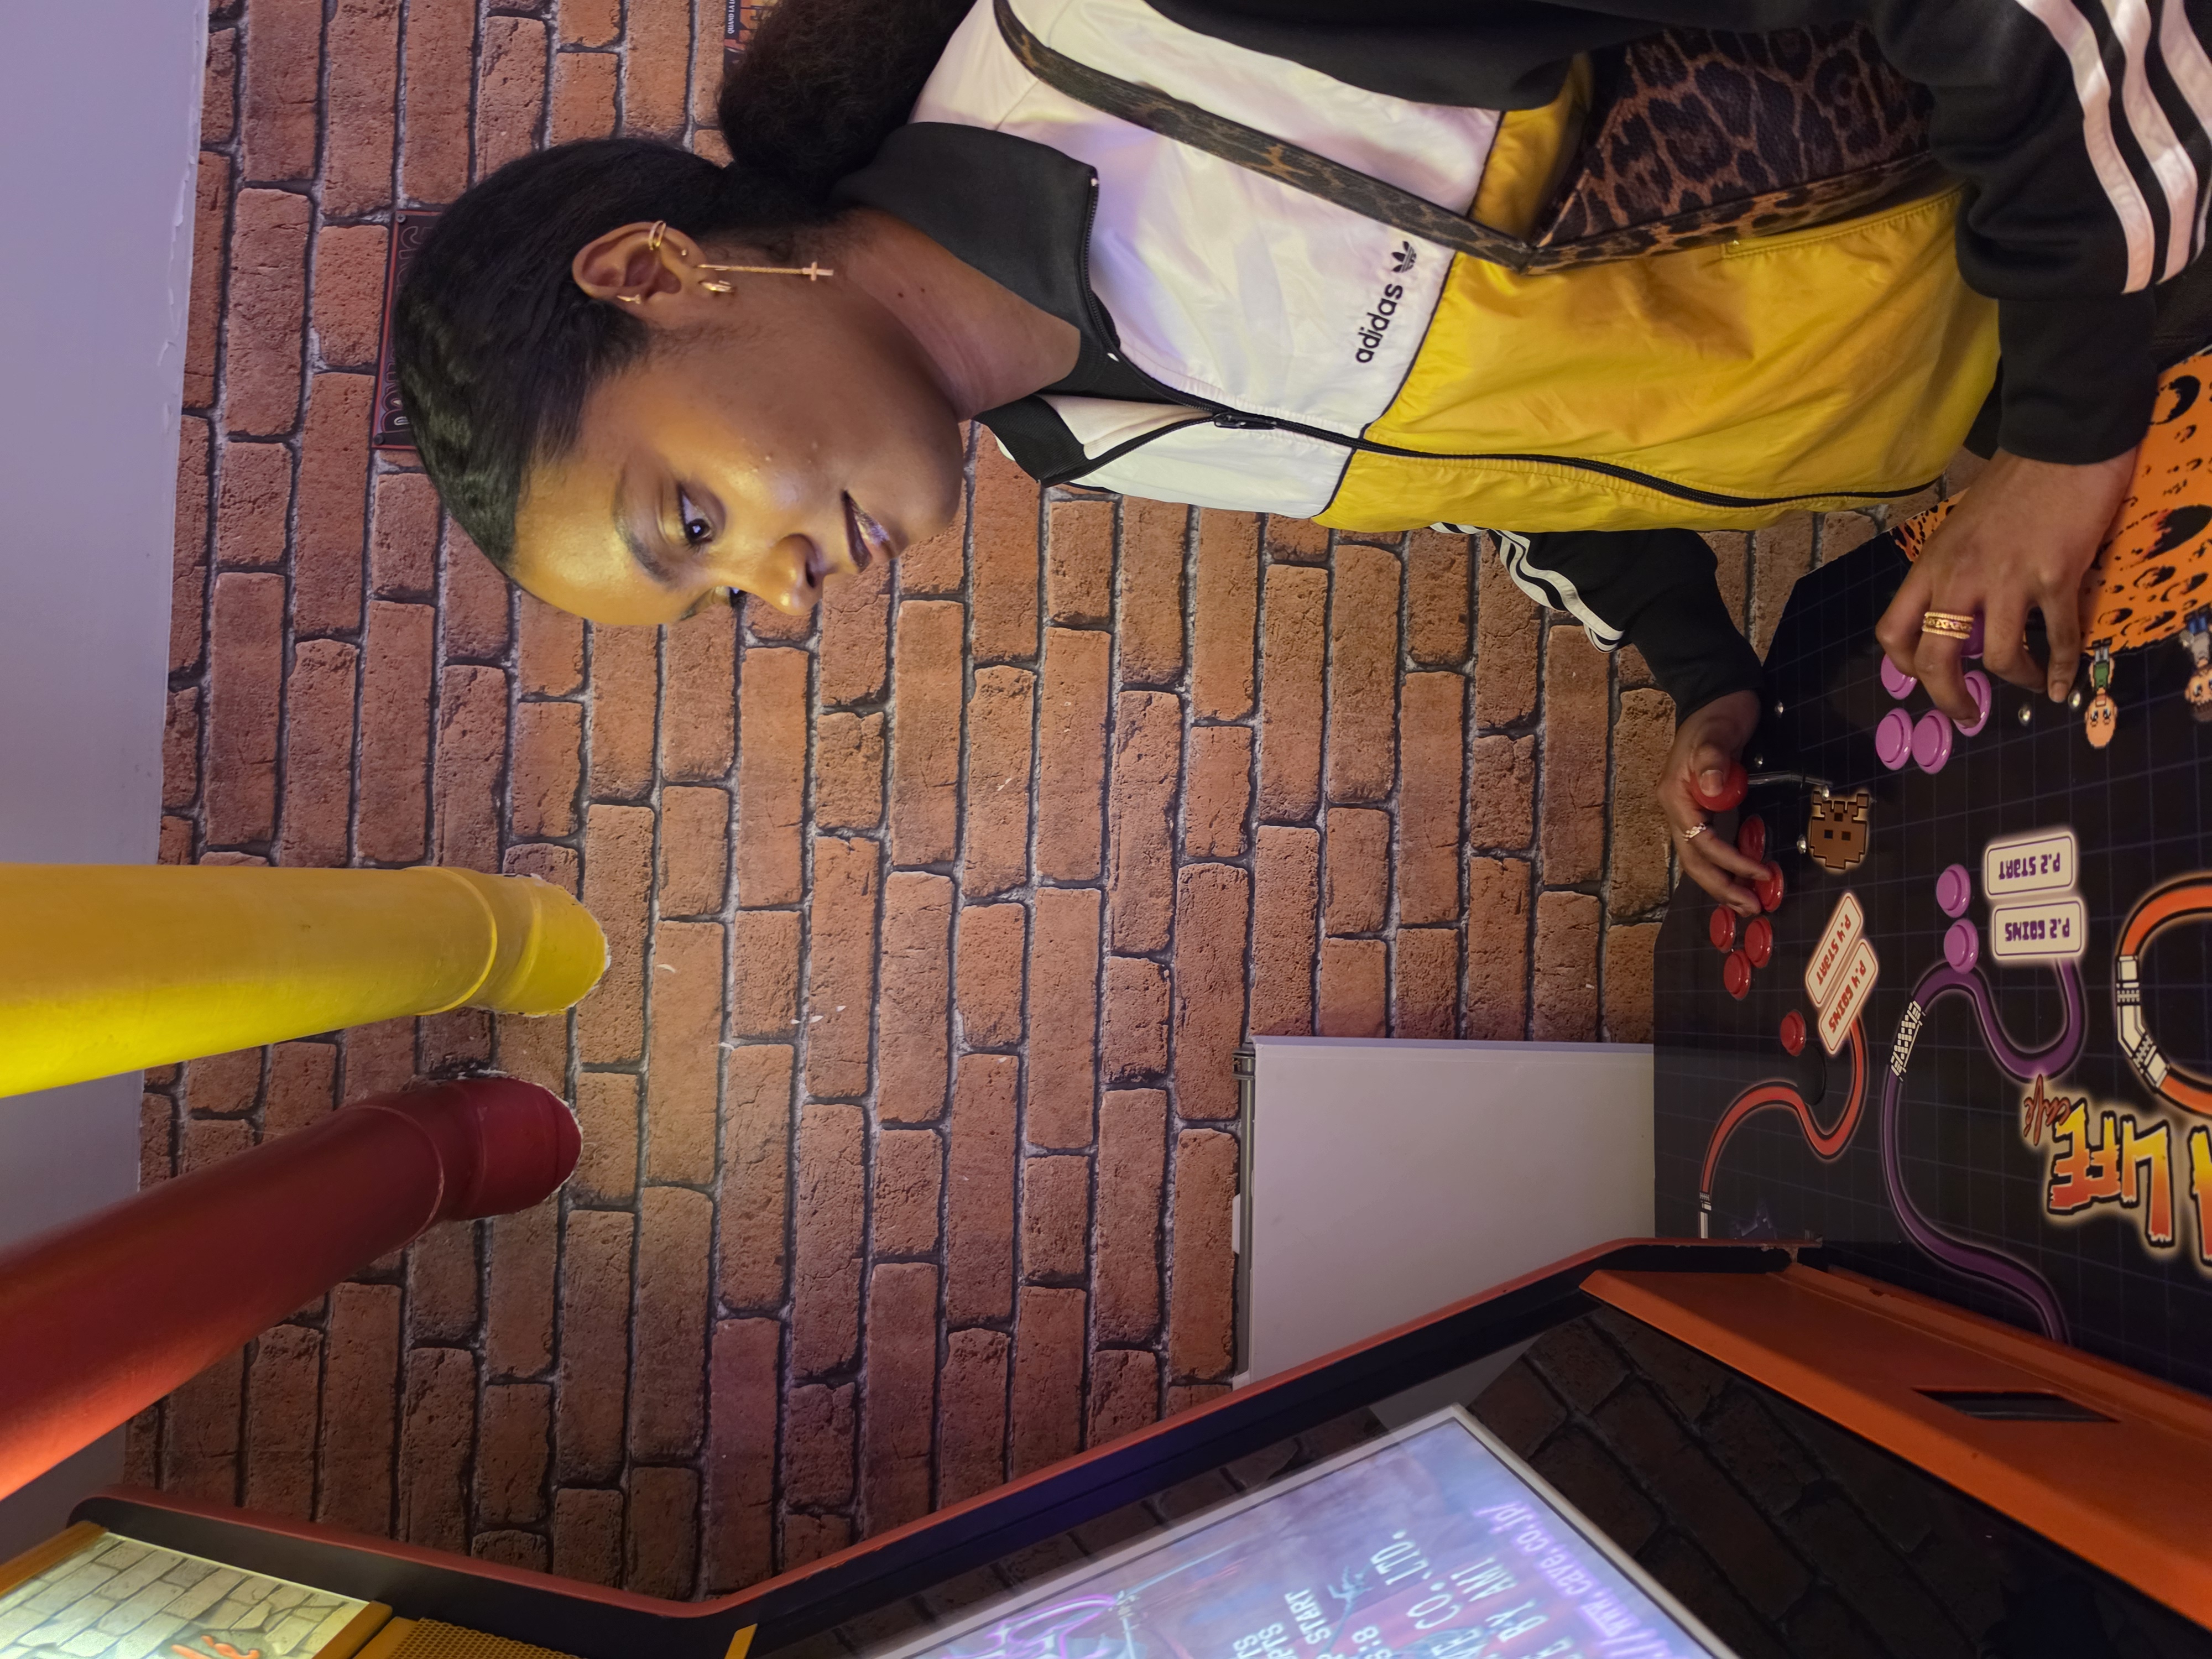
Video color rendering is generally pleasing, with natural tones and convincing skin tones across most daylight and indoor scenes. White balance can show noticeable oscillations during changes in illumination, especially under mixed or transitional lighting and at lower light levels, which affects consistency. In low light, skin tones can also appear slightly unnatural, particularly darker complexions.
Samsung Galaxy S26 Ultra – Slightly inaccurate skin tones and color
Samsung Galaxy S25 Ultra – Slightly inaccurate skin tones and color
Apple iPhone 17 Pro – Acceptable skin tones and color
For video, autofocus tests concentrate on focus accuracy, focus stability and analysis of convergence regarding speed and smoothness.
Autofocus is one of the weaker aspects of the S26 Ultra’s video performance. While the laser-assisted phase-detection system is mostly accurate in simple scenes, it is slow to adapt to abrupt focus plane changes, particularly in low light. Subject tracking lacks smoothness and continuity when following moving subjects, and occasional focus breathing is noticeable, especially during reframing or when subjects move toward or away from the camera.
Samsung Galaxy S26 Ultra – Slight loss of focus at the start of tracking
Texture tests analyze the level of details and texture of the real-life videos as well as the videos of charts recorded in the lab. Natural videos recordings are visually evaluated, with particular attention paid to the level of details in the bright and areas as well as in the dark. Objective measurements are performed of images of charts taken in various conditions from 0.1 to 10000 lux. The charts used are the DXOMARK chart (DMC) and Dead Leaves chart.
DXOMARK CHART (DMC) detail preservation video score vs lux levels
This graph shows the evolution of the DMC detail preservation video score with the level of lux in video. DMC detail preservation score is derived from an AI-based metric trained to evaluate texture and details rendering on a selection of crops of our DXOMARK chart.
Noise tests analyze various attributes of noise such as intensity, chromaticity, grain, structure, temporal aspects on real-life video recording as well as videos of charts taken in the lab. Natural videos are visually evaluated, with particular attention paid to the noise in the dark areas and high dynamic range conditions. Objective measurements are performed on the videos of charts recorded in various conditions from 0.1 to 10000 lux. The chart used is the DXOMARK visual noise chart.
Spatial visual noise evolution with the illuminance level
This graph shows the evolution of spatial visual noise with the level of lux. Spatial visual noise is measured on the visual noise chart in the video noise setup. DXOMARK visual noise measurement is derived from ISO15739 standard.
Temporal visual noise evolution with the illuminance level
This graph shows the evolution of temporal visual noise with the level of lux. Temporal visual noise is measured on the visual noise chart in the video noise setup.
The S26 Ultra’s approach to video texture and noise tuning differs from that of the S25 Ultra, which is particularly noticeable in low light. Texture rendering is acceptable, with sufficient detail for most use cases, though in daylight recording, a loss of very fine detail and sharpness is noticeable compared to the best competitors in the segment and even the predecessor S25 Ultra.
Noise is well controlled in daylight and under typical indoor lighting — a clear differentiator from the S25 Ultra, enabled by the newer model’s wider aperture. In low light, Samsung appears to prioritize clean, noise-free images, particularly in portrait scenes, applying relatively aggressive denoising. While this results in visually cleaner footage, it comes at the expense of detail preservation in many situations, introducing artifacts such as areas of moving texture and background deformations.
Samsung Galaxy S26 Ultra – Well controlled noise, loss of detail
Samsung Galaxy S25 Ultra – Visible noise, lack of detail
Apple iPhone 17 Pro – Well controlled noise, loss of fine detail
Stabilization evaluation tests the ability of the device to stabilize footage thanks to software or hardware technologies such as OIS, EIS, or any others means. The evaluation looks at residual motion, smoothness, jello artifacts and residual motion blur on walk and run use cases in various lighting conditions. The video below is an extract from one of the tested scenes.
Video stabilization is another strong point of the S26 Ultra, even with the new horizon lock feature — designed to keep framing level — disabled. This feature is not covered by our test protocol, as it is disabled by default. The system performs well at keeping footage stable when walking, when recording handheld while stationary, and even during more dynamic camera motion. Footage is smooth and watchable, broadly comparable to that of the iPhone 17 Pro in most conditions.
On the downside, minor frame shifts are noticeable during small panning movements, likely due to interaction between the optical and electronic components of the stabilization system. While not dramatic, this artifact can be distracting in otherwise smooth sequences.
Artifacts are evaluated with MTF and ringing measurements on the SFR chart in the lab as well as frame-rate measurements using the LED Universal Timer. Natural videos are visually evaluated by paying particular attention to artifacts such as aliasing, quantization, blocking, and hue shift, among others. The more severe and the more frequent the artifact, the higher the point deduction from the score. The main artifacts and corresponding point loss are listed below.
All image quality attributes are evaluated at focal lengths from approximately 12 mm to 300 mm, with particular attention paid to texture and smoothness of the zooming effect. The score is derived from a number of objective measurements in the lab and perceptual analysis of real-life video recordings.
DXOMARK CHART (DMC) detail preservation score per focal length
This graph shows the evolution of the DMC detail preservation score with respect to the full-frame equivalent focal length for different light conditions. The x-axis represents the equivalent focal length measured for each corresponding shooting distance and the y-axis represents the maximum details preservation metric score: higher value means better quality. Large dots correspond to zoom ratio available in the user interface of the camera application.
Compared to the S25 Ultra, the S26 Ultra shows a significant decrease in texture measurements when zooming in video mode, indicating a clear loss of fine detail when recording across both the telephoto and ultra-wide camera modules. Despite this, the rendering appears more natural, with fewer artifacts, less noise, and reduced oversharpening. Samsung is likely to address the texture tuning in an upcoming firmware update, and may yet match or surpass the S25 Ultra’s texture measurements in the near future.
Samsung Galaxy S26 Ultra – Slight field-of-view jumps between camera modules, relatively consistent image quality
Samsung Galaxy S25 Ultra – Slight field-of-view jumps between camera modules, consistent image quality
Apple iPhone 17 Pro – Slight field-of-view jumps between camera modules, consistent image quality